move the mouse pointer over that image.
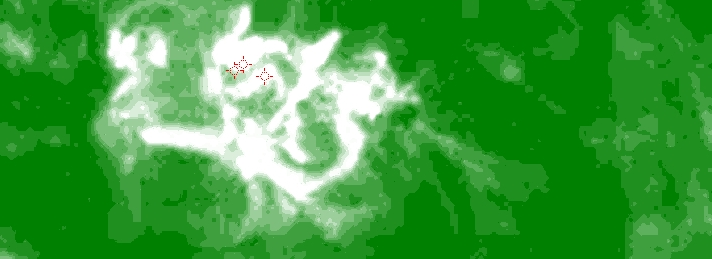
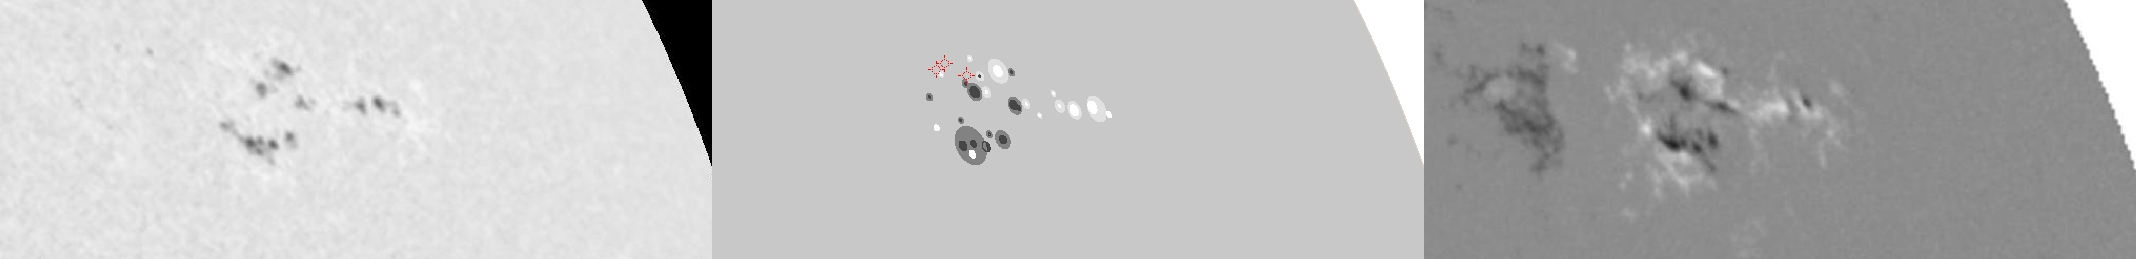
| Evolution of sunspot group NOAA 10338 and positions of flares in it animated by using the data of SOHO/MDI Debrecen Data (SDD) sunspot catalogue (lower panel, middle, ellipses with positions and areas corresponding to the relevant data of spots in SDD and with grey-scale colour coding of the magnetic polarities corresponding to that of the magnetograms), SOHO/MDI continuum images (lower panel, left) and magnetograms (lower panel, right), SOHO/EIT images (upper panel, middle), GOES and RHESSI flare data (red and blue symbols) observed within the interval around the time of SDD data. |
|
When you want to zoom in on one of the images, simply move the mouse pointer over that image. |
 |
| Year | Month | Day | Hour | Min | Sec | NOAA | Proj.U | Proj.WS | Corr.U | Corr.WS | B | L | LCM | Pos.angle | r | MU | MP |
|---|---|---|---|---|---|---|---|---|---|---|---|---|---|---|---|---|---|
| 2003 | 04 | 24 | 23 | 59 | 33 | 10338 | 85 | 373 | 65 | 287 | 18.21 | 284.85 | 44.91 | 298.79 | 0.7665 | -105.3 | 6.1 |
| Flare | Date | Start | Peak | End | Dur [s] | Peak [c/s] | Total Counts | Energy [keV] | X pos [asec] | Y pos [asec] | Radial [asec] | B [deg] | L [deg] | Flags |
|---|---|---|---|---|---|---|---|---|---|---|---|---|---|---|
| 30424100 | 24-Apr-2003 | 23:19:36 | 23:32:22 | 23:38:32 | 1136 | 240 | 512976 | 6-12 | 612 | 385 | 723 | 20.04 | 281.71 | A0 DF P1 |
| 30424101 | 24-Apr-2003 | 23:38:32 | 23:39:30 | 23:48:04 | 572 | 36 | 49680 | 6-12 | 608 | 381 | 718 | 19.75 | 281.21 | A0 DF DR P1 PE |
| 3042483 | 24-Apr-2003 | 23:53:08 | 23:54:54 | 23:59:16 | 368 | 28 | 30096 | 6-12 | 630 | 377 | 735 | 19.61 | 282.93 | A0 DF DR P1 |
| Date | Start | Peak | End | Classification | B [deg] | LCM [deg] |
|---|---|---|---|---|---|---|
| No data |

