move the mouse pointer over that image.
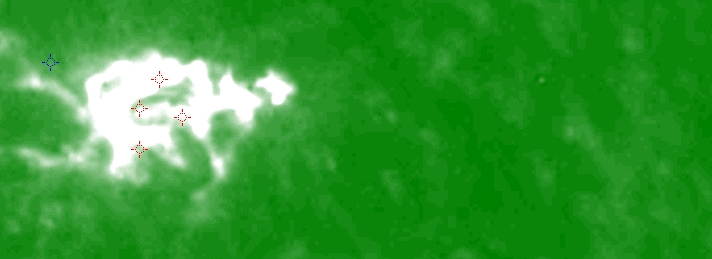
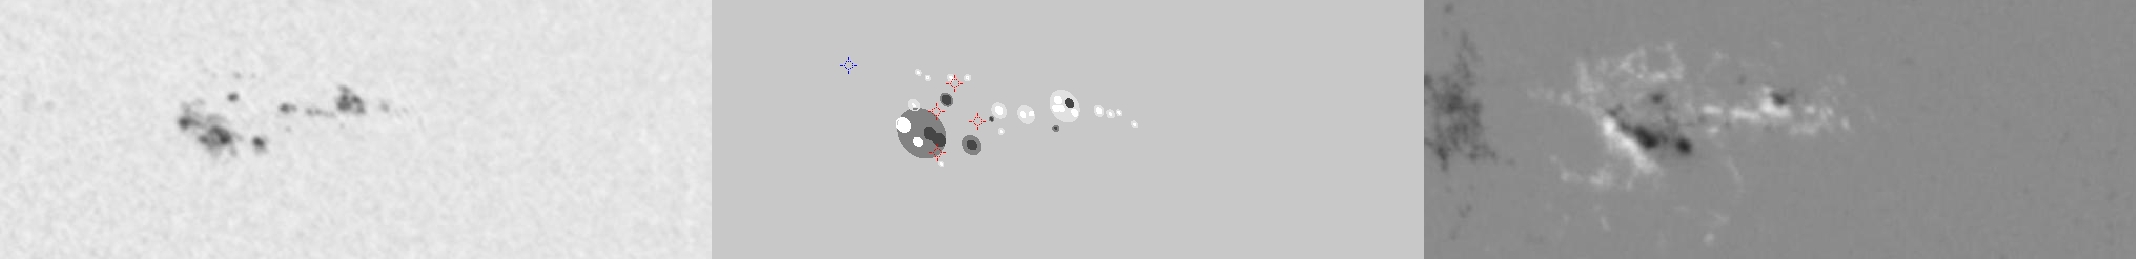
| Evolution of sunspot group NOAA 10338 and positions of flares in it animated by using the data of SOHO/MDI Debrecen Data (SDD) sunspot catalogue (lower panel, middle, ellipses with positions and areas corresponding to the relevant data of spots in SDD and with grey-scale colour coding of the magnetic polarities corresponding to that of the magnetograms), SOHO/MDI continuum images (lower panel, left) and magnetograms (lower panel, right), SOHO/EIT images (upper panel, middle), GOES and RHESSI flare data (red and blue symbols) observed within the interval around the time of SDD data. |
|
When you want to zoom in on one of the images, simply move the mouse pointer over that image. |
 |
| Year | Month | Day | Hour | Min | Sec | NOAA | Proj.U | Proj.WS | Corr.U | Corr.WS | B | L | LCM | Pos.angle | r | MU | MP |
|---|---|---|---|---|---|---|---|---|---|---|---|---|---|---|---|---|---|
| 2003 | 04 | 23 | 20 | 09 | 33 | 10338 | 117 | 511 | 74 | 315 | 17.88 | 284.71 | 29.47 | 309.01 | 0.6031 | -34.6 | 122.2 |
| Flare | Date | Start | Peak | End | Dur [s] | Peak [c/s] | Total Counts | Energy [keV] | X pos [asec] | Y pos [asec] | Radial [asec] | B [deg] | L [deg] | Flags |
|---|---|---|---|---|---|---|---|---|---|---|---|---|---|---|
| 3042322 | 23-Apr-2003 | 15:32:24 | 15:47:38 | 16:12:00 | 2376 | 818 | 3665712 | 12-25 | 374 | 373 | 529 | 18.25 | 280.70 | a0 A1 DF DR EE P1 PE |
| 3042312 | 23-Apr-2003 | 17:11:44 | 17:11:54 | 17:12:04 | 20 | 1 | 106 | 6-12 | 408 | 390 | 565 | 19.46 | 282.50 | A0 DF DR P1 PE |
| 3042355 | 23-Apr-2003 | 17:36:32 | 17:37:18 | 17:38:04 | 92 | 0 | 154 | 6-12 | 429 | 366 | 564 | 17.95 | 283.49 | A0 DF P1 |
| 3042384 | 23-Apr-2003 | 19:01:56 | 19:04:34 | 19:13:08 | 672 | 64 | 79584 | 6-12 | 426 | 345 | 549 | 16.59 | 282.25 | A0 DF DR P1 |
| Date | Start | Peak | End | Classification | B [deg] | LCM [deg] |
|---|---|---|---|---|---|---|
| 23-Apr-2003 | 15:36 | 15:56 | 16:11 | M2.0 | 20 | 22 |

