move the mouse pointer over that image.
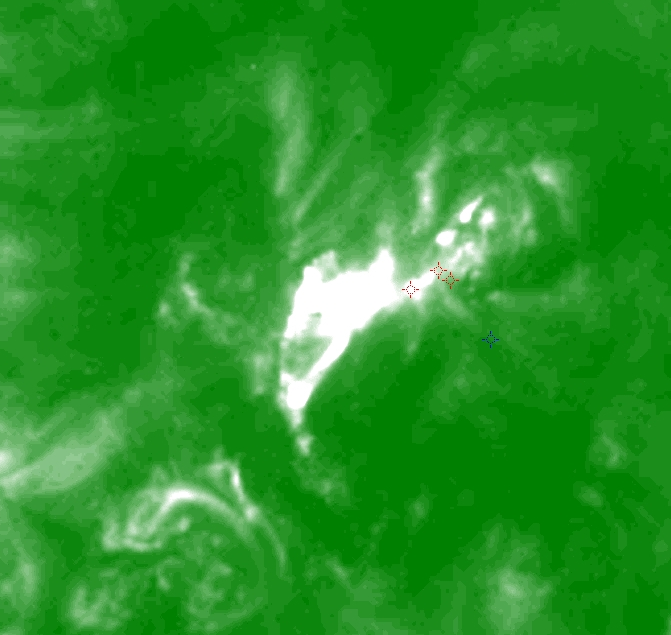
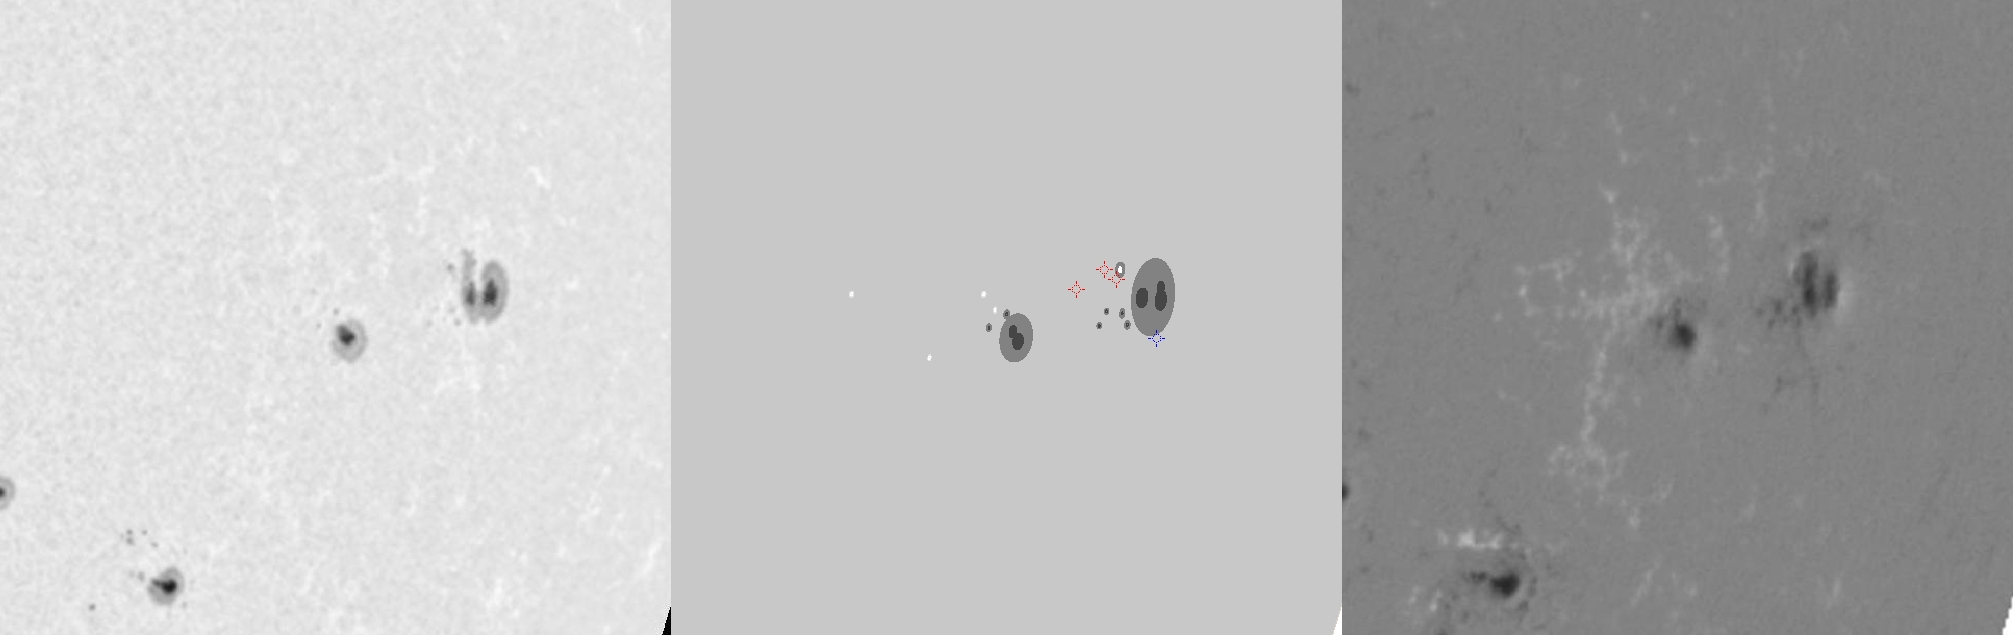
| Evolution of sunspot group NOAA 9866 and positions of flares in it animated by using the data of SOHO/MDI Debrecen Data (SDD) sunspot catalogue (lower panel, middle, ellipses with positions and areas corresponding to the relevant data of spots in SDD and with grey-scale colour coding of the magnetic polarities corresponding to that of the magnetograms), SOHO/MDI continuum images (lower panel, left) and magnetograms (lower panel, right), SOHO/EIT images (upper panel, middle), GOES and RHESSI flare data (red and blue symbols) observed within the interval around the time of SDD data. |
|
When you want to zoom in on one of the images, simply move the mouse pointer over that image. |
 |
| Year | Month | Day | Hour | Min | Sec | NOAA | Proj.U | Proj.WS | Corr.U | Corr.WS | B | L | LCM | Pos.angle | r | MU | MP |
|---|---|---|---|---|---|---|---|---|---|---|---|---|---|---|---|---|---|
| 2002 | 03 | 19 | 11 | 11 | 33 | 9866 | 87 | 565 | 75 | 483 | -9.08 | 194.20 | 54.95 | 263.82 | 0.8136 | -878.6 | -308.0 |
| Flare | Date | Start | Peak | End | Dur [s] | Peak [c/s] | Total Counts | Energy [keV] | X pos [asec] | Y pos [asec] | Radial [asec] | B [deg] | L [deg] | Flags |
|---|---|---|---|---|---|---|---|---|---|---|---|---|---|---|
| 2031907 | 19-Mar-2002 | 11:09:52 | 11:16:38 | 11:22:40 | 768 | 100 | 303888 | 12-25 | 759 | -74 | 762 | -8.72 | 191.43 | A1 DF P1 PE Q3 |
| 2031920 | 19-Mar-2002 | 11:51:52 | 11:51:58 | 11:57:20 | 328 | 40 | 61968 | 12-25 | 782 | -63 | 784 | -7.84 | 193.30 | A1 DF GS P1 |
| 2031923 | 19-Mar-2002 | 11:57:20 | 11:57:22 | 12:08:08 | 648 | 32 | 101472 | 12-25 | 790 | -69 | 793 | -8.11 | 194.17 | A1 DF P1 |
| Date | Start | Peak | End | Classification | B [deg] | LCM [deg] |
|---|---|---|---|---|---|---|
| 19-Mar-2002 | 11:06 | 11:44 | 12:31 | M1.0 | -10 | 58 |

