move the mouse pointer over that image.
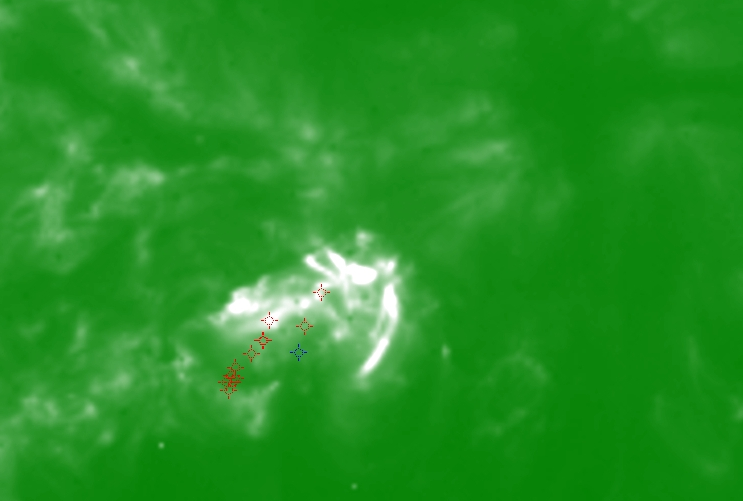
| Evolution of sunspot group NOAA 9830 and positions of flares in it animated by using the data of SOHO/MDI Debrecen Data (SDD) sunspot catalogue (lower panel, middle, ellipses with positions and areas corresponding to the relevant data of spots in SDD and with grey-scale colour coding of the magnetic polarities corresponding to that of the magnetograms), SOHO/MDI continuum images (lower panel, left) and magnetograms (lower panel, right), SOHO/EIT images (upper panel, middle), GOES and RHESSI flare data (red and blue symbols) observed within the interval around the time of SDD data. |
|
When you want to zoom in on one of the images, simply move the mouse pointer over that image. |
 |
| Year | Month | Day | Hour | Min | Sec | NOAA | Proj.U | Proj.WS | Corr.U | Corr.WS | B | L | LCM | Pos.angle | r | MU | MP |
|---|---|---|---|---|---|---|---|---|---|---|---|---|---|---|---|---|---|
| 2002 | 02 | 18 | 22 | 23 | 32 | 9830 | 195 | 1142 | 103 | 593 | -18.33 | 140.65 | -14.50 | 130.44 | 0.3139 | 419.6 | -79.8 |
| Flare | Date | Start | Peak | End | Dur [s] | Peak [c/s] | Total Counts | Energy [keV] | X pos [asec] | Y pos [asec] | Radial [asec] | B [deg] | L [deg] | Flags |
|---|---|---|---|---|---|---|---|---|---|---|---|---|---|---|
| 2021882 | 18-Feb-2002 | 19:20:04 | 19:24:58 | 19:37:20 | 1036 | 112 | 381168 | 6-12 | -264 | -185 | 322 | -17.73 | 139.31 | A0 P1 PE |
| 2021842 | 18-Feb-2002 | 19:37:20 | 19:44:46 | 19:47:52 | 632 | 136 | 303288 | 6-12 | -269 | -206 | 339 | -18.99 | 138.68 | A0 |
| 2021825 | 18-Feb-2002 | 20:18:40 | 20:53:30 | 21:12:48 | 3248 | 304 | 2736546 | 12-25 | -272 | -202 | 339 | -18.74 | 137.88 | a0 A1 P1 PE |
| 2021883 | 18-Feb-2002 | 21:12:48 | 21:13:38 | 21:19:20 | 392 | 208 | 392256 | 12-25 | -270 | -214 | 345 | -19.48 | 137.75 | A1 |
| 2021873 | 18-Feb-2002 | 21:19:20 | 21:19:38 | 21:21:16 | 116 | 192 | 110016 | 12-25 | -269 | -214 | 344 | -19.48 | 137.76 | A1 |
| 2021843 | 18-Feb-2002 | 21:54:20 | 21:55:26 | 22:08:56 | 876 | 38 | 131472 | 6-12 | -266 | -222 | 347 | -19.97 | 137.57 | A1 P1 PE |
| 2021885 | 18-Feb-2002 | 22:28:48 | 22:28:50 | 22:30:12 | 84 | 18 | 8232 | 6-12 | -267 | -230 | 353 | -20.46 | 137.15 | A1 P1 PE |
| 2021886 | 18-Feb-2002 | 22:30:12 | 22:30:18 | 22:45:16 | 904 | 18 | 68890 | 6-12 | -269 | -235 | 357 | -20.76 | 136.96 | a0 A1 P1 PE |
| 2021887 | 18-Feb-2002 | 22:52:00 | 22:52:02 | 22:52:24 | 24 | 8 | 1107 | 6-12 | -261 | -237 | 352 | -20.90 | 137.28 | A0 |
| 2021888 | 18-Feb-2002 | 22:53:40 | 22:53:50 | 22:53:52 | 12 | 8 | 537 | 6-12 | -262 | -239 | 355 | -21.02 | 137.18 | A0 |
| 2021889 | 18-Feb-2002 | 22:55:20 | 22:55:26 | 22:55:28 | 8 | 7 | 315 | 6-12 | -264 | -244 | 359 | -21.32 | 137.00 | A0 |
| 2021847 | 18-Feb-2002 | 22:57:36 | 22:58:10 | 22:58:24 | 48 | 8 | 1990 | 6-12 | -265 | -239 | 357 | -21.02 | 136.95 | A0 |
| Date | Start | Peak | End | Classification | B [deg] | LCM [deg] |
|---|---|---|---|---|---|---|
| 18-Feb-2002 | 20:18 | 21:15 | 21:58 | M1.0 | -20 | -16 |

