
move the mouse pointer over that image.
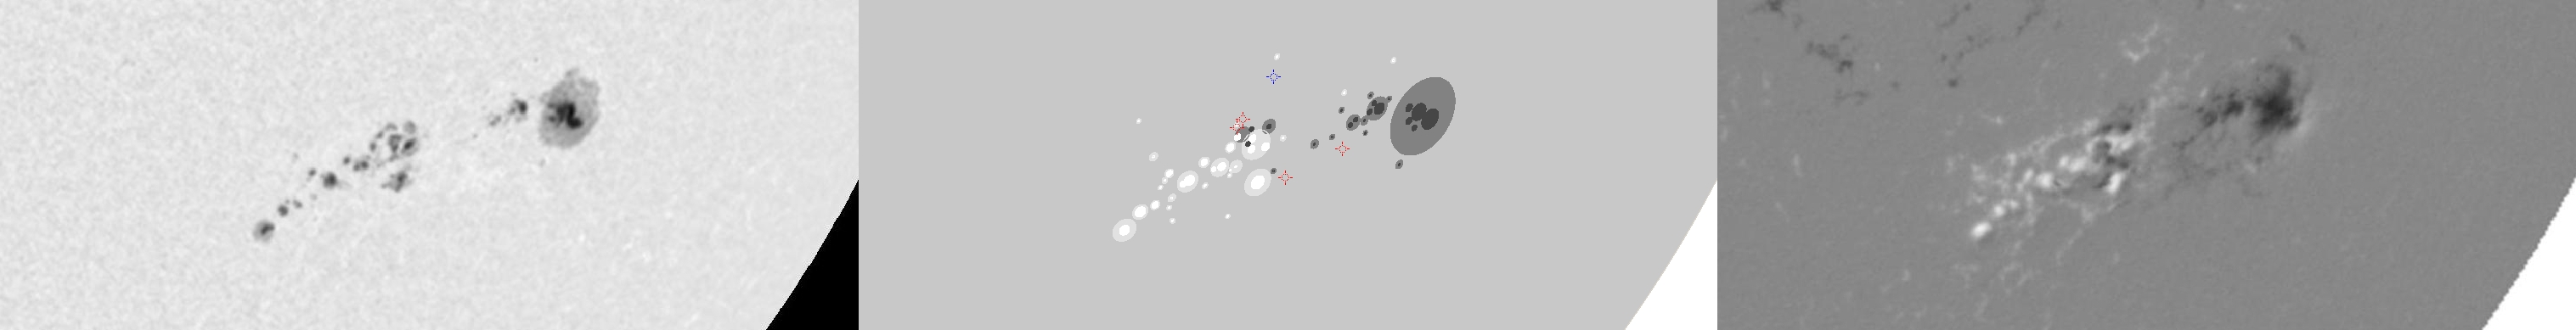
| Evolution of sunspot group NOAA 10226 and positions of flares in it animated by using the data of SOHO/MDI Debrecen Data (SDD) sunspot catalogue (lower panel, middle, ellipses with positions and areas corresponding to the relevant data of spots in SDD and with grey-scale colour coding of the magnetic polarities corresponding to that of the magnetograms), SOHO/MDI continuum images (lower panel, left) and magnetograms (lower panel, right), SOHO/EIT images (upper panel, middle), GOES and RHESSI flare data (red and blue symbols) observed within the interval around the time of SDD data. |
|
When you want to zoom in on one of the images, simply move the mouse pointer over that image. |
 |
| Year | Month | Day | Hour | Min | Sec | NOAA | Proj.U | Proj.WS | Corr.U | Corr.WS | B | L | LCM | Pos.angle | r | MU | MP |
|---|---|---|---|---|---|---|---|---|---|---|---|---|---|---|---|---|---|
| 2002 | 12 | 20 | 22 | 23 | 32 | 10226 | 275 | 1458 | 200 | 1070 | -26.72 | 129.77 | 41.67 | 233.61 | 0.7370 | -41.3 | -79.5 |
| Flare | Date | Start | Peak | End | Dur [s] | Peak [c/s] | Total Counts | Energy [keV] | X pos [asec] | Y pos [asec] | Radial [asec] | B [deg] | L [deg] | Flags |
|---|---|---|---|---|---|---|---|---|---|---|---|---|---|---|
| 2122031 | 20-Dec-2002 | 21:36:16 | 21:40:42 | 21:47:48 | 692 | 200 | 156384 | 12-25 | 502 | -410 | 648 | -26.45 | 122.98 | A0 DF DR P1 |
| 2122090 | 20-Dec-2002 | 21:53:36 | 21:58:58 | 22:00:16 | 400 | 64 | 83208 | 6-12 | 583 | -426 | 723 | -27.39 | 130.22 | A0 DF DR P1 |
| 21220110 | 20-Dec-2002 | 22:00:16 | 22:03:46 | 22:11:20 | 664 | 112 | 199800 | 6-12 | 542 | -447 | 703 | -28.85 | 127.16 | A0 DF DR P1 |
| 2122092 | 20-Dec-2002 | 22:20:12 | 22:23:54 | 22:28:08 | 476 | 272 | 189408 | 12-25 | 516 | -404 | 656 | -26.04 | 123.59 | A0 DF DR P1 |
| Date | Start | Peak | End | Classification | B [deg] | LCM [deg] |
|---|---|---|---|---|---|---|
| 20-Dec-2002 | 23:01 | 23:04 | 23:07 | C1.7 | -24 | 37 |

