
move the mouse pointer over that image.
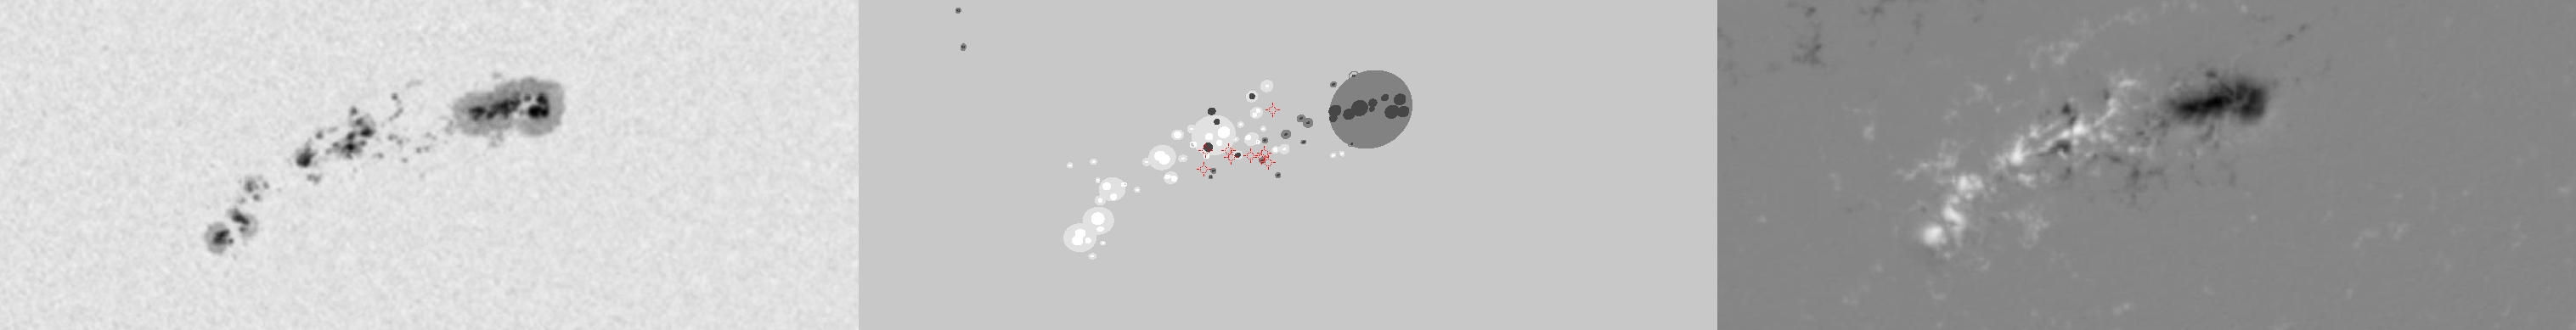
| Evolution of sunspot group NOAA 10226 and positions of flares in it animated by using the data of SOHO/MDI Debrecen Data (SDD) sunspot catalogue (lower panel, middle, ellipses with positions and areas corresponding to the relevant data of spots in SDD and with grey-scale colour coding of the magnetic polarities corresponding to that of the magnetograms), SOHO/MDI continuum images (lower panel, left) and magnetograms (lower panel, right), SOHO/EIT images (upper panel, middle), GOES and RHESSI flare data (red and blue symbols) observed within the interval around the time of SDD data. |
|
When you want to zoom in on one of the images, simply move the mouse pointer over that image. |
 |
| Year | Month | Day | Hour | Min | Sec | NOAA | Proj.U | Proj.WS | Corr.U | Corr.WS | B | L | LCM | Pos.angle | r | MU | MP |
|---|---|---|---|---|---|---|---|---|---|---|---|---|---|---|---|---|---|
| 2002 | 12 | 18 | 16 | 30 | 32 | 10226 | 350 | 1954 | 199 | 1102 | -26.77 | 129.18 | 11.49 | 202.49 | 0.4759 | -253.5 | -108.0 |
| Flare | Date | Start | Peak | End | Dur [s] | Peak [c/s] | Total Counts | Energy [keV] | X pos [asec] | Y pos [asec] | Radial [asec] | B [deg] | L [deg] | Flags |
|---|---|---|---|---|---|---|---|---|---|---|---|---|---|---|
| 2121872 | 18-Dec-2002 | 14:08:08 | 14:08:18 | 14:10:56 | 168 | 88 | 62976 | 6-12 | 124 | -431 | 448 | -27.79 | 126.20 | A0 DF GS P1 |
| 21218110 | 18-Dec-2002 | 14:10:56 | 14:13:18 | 14:15:44 | 288 | 72 | 94176 | 6-12 | 150 | -428 | 454 | -27.59 | 127.90 | A0 DF P1 |
| 21218111 | 18-Dec-2002 | 14:15:44 | 14:18:58 | 14:22:00 | 376 | 72 | 118560 | 6-12 | 141 | -430 | 453 | -27.72 | 127.25 | A0 DF P1 |
| 21218112 | 18-Dec-2002 | 14:22:00 | 14:23:54 | 14:27:48 | 348 | 72 | 111168 | 6-12 | 151 | -431 | 457 | -27.79 | 127.89 | A0 DF P1 |
| 2121873 | 18-Dec-2002 | 15:04:00 | 15:07:18 | 15:14:36 | 636 | 496 | 666360 | 6-12 | 121 | -426 | 443 | -27.46 | 125.43 | A0 DF P1 |
| 21218113 | 18-Dec-2002 | 15:14:36 | 15:17:50 | 15:26:04 | 688 | 88 | 212544 | 6-12 | 173 | -396 | 432 | -25.48 | 128.67 | A0 DF P1 PE |
| 2121875 | 18-Dec-2002 | 15:48:52 | 15:52:34 | 15:56:00 | 428 | 44 | 91872 | 6-12 | 150 | -426 | 452 | -27.46 | 126.98 | A0 DF P1 |
| 2121877 | 18-Dec-2002 | 16:40:04 | 16:41:26 | 16:45:00 | 296 | 368 | 481200 | 6-12 | 192 | -435 | 475 | -28.05 | 129.48 | A0 DF ES P1 |
| 21218114 | 18-Dec-2002 | 16:45:00 | 16:52:02 | 17:03:56 | 1136 | 1136 | 3009600 | 12-25 | 147 | -440 | 464 | -28.40 | 126.32 | A0 DF DR P1 |
| Date | Start | Peak | End | Classification | B [deg] | LCM [deg] |
|---|---|---|---|---|---|---|
| No data |

