move the mouse pointer over that image.
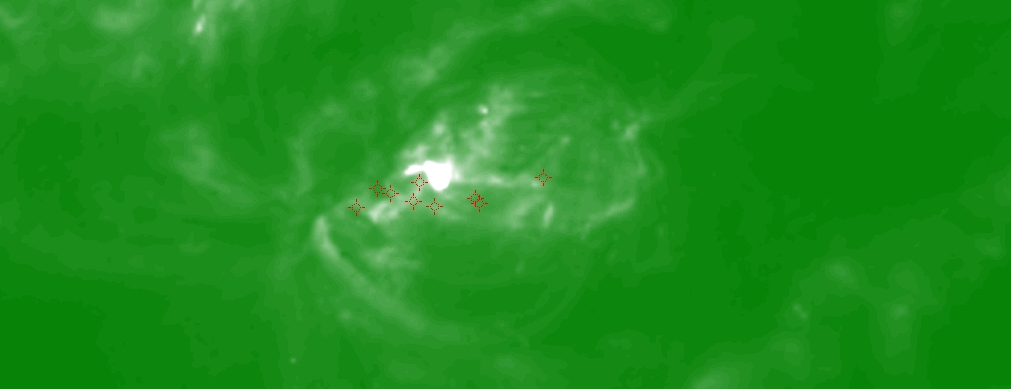
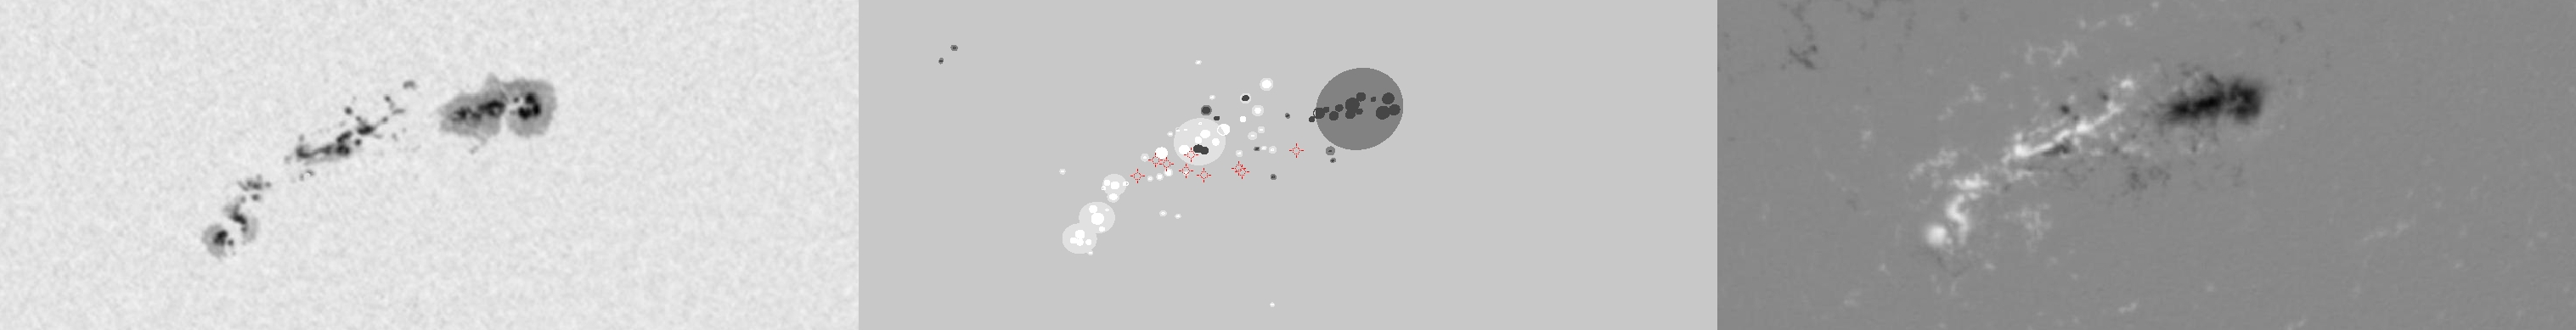
| Evolution of sunspot group NOAA 10226 and positions of flares in it animated by using the data of SOHO/MDI Debrecen Data (SDD) sunspot catalogue (lower panel, middle, ellipses with positions and areas corresponding to the relevant data of spots in SDD and with grey-scale colour coding of the magnetic polarities corresponding to that of the magnetograms), SOHO/MDI continuum images (lower panel, left) and magnetograms (lower panel, right), SOHO/EIT images (upper panel, middle), GOES and RHESSI flare data (red and blue symbols) observed within the interval around the time of SDD data. |
|
When you want to zoom in on one of the images, simply move the mouse pointer over that image. |
 |
| Year | Month | Day | Hour | Min | Sec | NOAA | Proj.U | Proj.WS | Corr.U | Corr.WS | B | L | LCM | Pos.angle | r | MU | MP |
|---|---|---|---|---|---|---|---|---|---|---|---|---|---|---|---|---|---|
| 2002 | 12 | 18 | 09 | 35 | 32 | 10226 | 371 | 1989 | 206 | 1105 | -26.76 | 129.29 | 7.81 | 196.09 | 0.4576 | -209.6 | -109.0 |
| Flare | Date | Start | Peak | End | Dur [s] | Peak [c/s] | Total Counts | Energy [keV] | X pos [asec] | Y pos [asec] | Radial [asec] | B [deg] | L [deg] | Flags |
|---|---|---|---|---|---|---|---|---|---|---|---|---|---|---|
| 2121864 | 18-Dec-2002 | 09:09:04 | 09:11:14 | 09:15:20 | 376 | 80 | 136560 | 6-12 | 110 | -439 | 453 | -28.30 | 128.00 | A0 DF DR GS P1 |
| 21218108 | 18-Dec-2002 | 09:15:20 | 09:16:46 | 09:31:44 | 984 | 64 | 212448 | 6-12 | 114 | -442 | 457 | -28.50 | 128.23 | A0 DF P1 |
| 2121865 | 18-Dec-2002 | 09:32:52 | 09:33:22 | 09:35:16 | 144 | 38 | 25056 | 6-12 | 77 | -441 | 448 | -28.44 | 125.56 | A0 DF P1 |
| 2121813 | 18-Dec-2002 | 10:49:52 | 10:52:22 | 10:57:52 | 480 | 46 | 56304 | 6-12 | 102 | -429 | 441 | -27.64 | 126.49 | A0 DF GS P1 |
| 2121850 | 18-Dec-2002 | 11:06:12 | 11:07:26 | 11:10:44 | 272 | 88 | 60936 | 6-12 | 88 | -436 | 445 | -28.11 | 125.43 | A0 DF P1 |
| 2121867 | 18-Dec-2002 | 11:12:32 | 11:13:58 | 11:15:28 | 176 | 84 | 45480 | 6-12 | 68 | -445 | 450 | -28.72 | 124.04 | A0 DF P1 |
| 2121817 | 18-Dec-2002 | 11:51:24 | 11:51:54 | 12:03:00 | 696 | 3312 | 4777584 | 6-12 | 127 | -444 | 462 | -28.65 | 127.72 | A0 DF ES GE P1 PE |
| 2121851 | 18-Dec-2002 | 12:32:32 | 12:33:22 | 12:34:00 | 88 | 112 | 36240 | 6-12 | 206 | -426 | 473 | -27.43 | 132.64 | A0 DF P1 |
| 2121870 | 18-Dec-2002 | 12:47:12 | 12:48:34 | 12:49:28 | 136 | 28 | 19200 | 6-12 | 107 | -433 | 447 | -27.92 | 125.78 | A0 DF P1 |
| Date | Start | Peak | End | Classification | B [deg] | LCM [deg] |
|---|---|---|---|---|---|---|
| No data |

