move the mouse pointer over that image.
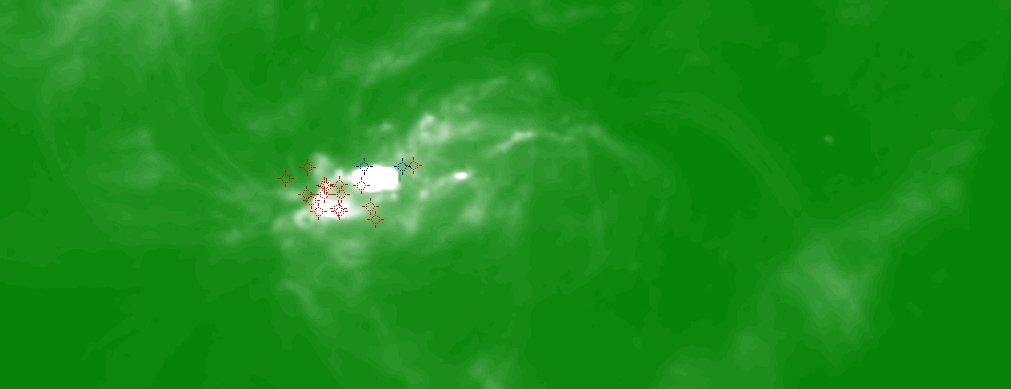
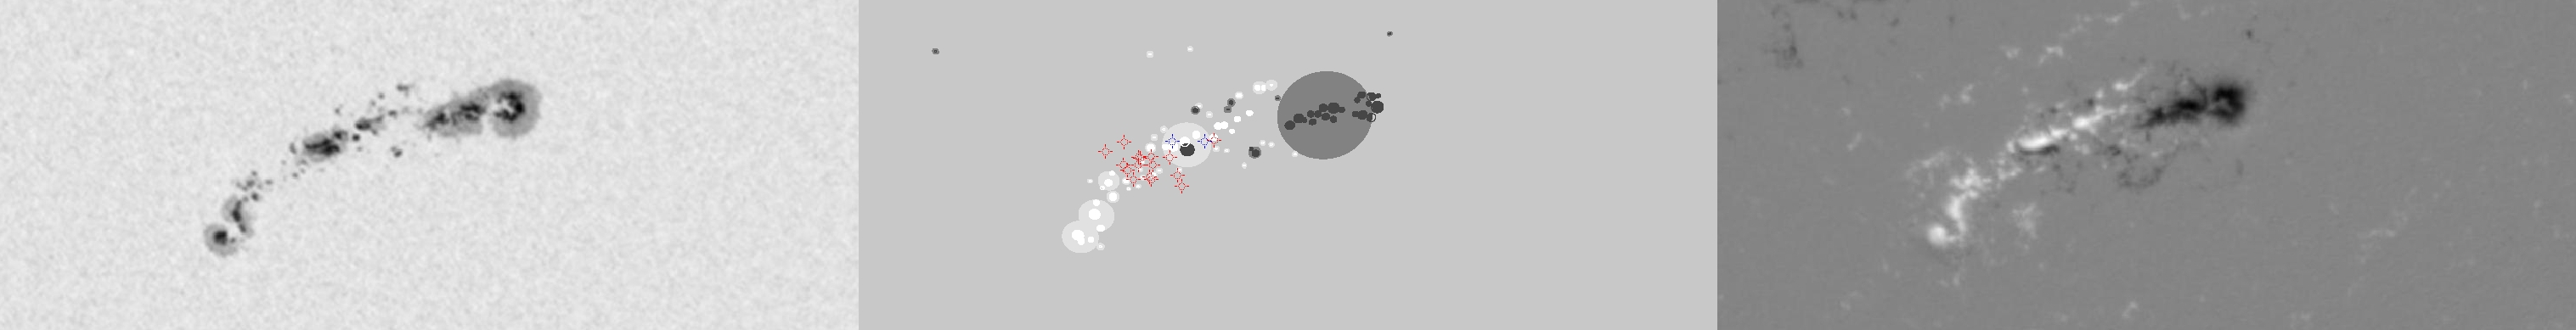
| Evolution of sunspot group NOAA 10226 and positions of flares in it animated by using the data of SOHO/MDI Debrecen Data (SDD) sunspot catalogue (lower panel, middle, ellipses with positions and areas corresponding to the relevant data of spots in SDD and with grey-scale colour coding of the magnetic polarities corresponding to that of the magnetograms), SOHO/MDI continuum images (lower panel, left) and magnetograms (lower panel, right), SOHO/EIT images (upper panel, middle), GOES and RHESSI flare data (red and blue symbols) observed within the interval around the time of SDD data. |
|
When you want to zoom in on one of the images, simply move the mouse pointer over that image. |
 |
| Year | Month | Day | Hour | Min | Sec | NOAA | Proj.U | Proj.WS | Corr.U | Corr.WS | B | L | LCM | Pos.angle | r | MU | MP |
|---|---|---|---|---|---|---|---|---|---|---|---|---|---|---|---|---|---|
| 2002 | 12 | 17 | 23 | 59 | 32 | 10226 | 377 | 2155 | 210 | 1189 | -26.81 | 129.00 | 2.24 | 185.33 | 0.4416 | -183.0 | -26.9 |
| Flare | Date | Start | Peak | End | Dur [s] | Peak [c/s] | Total Counts | Energy [keV] | X pos [asec] | Y pos [asec] | Radial [asec] | B [deg] | L [deg] | Flags |
|---|---|---|---|---|---|---|---|---|---|---|---|---|---|---|
| 21217103 | 17-Dec-2002 | 23:23:20 | 23:33:22 | 00:01:48 | 2308 | 752 | 2172362 | 25-50 | -12 | -432 | 432 | -27.79 | 125.02 | a0 A1 DF DR P1 |
| 2121839 | 18-Dec-2002 | 00:37:52 | 00:38:18 | 00:41:12 | 200 | 240 | 205211 | 6-12 | 14 | -453 | 453 | -29.21 | 126.19 | A0 a1 DF P1 |
| 2121898 | 18-Dec-2002 | 00:41:12 | 00:42:46 | 00:46:56 | 344 | 204 | 299088 | 6-12 | 12 | -445 | 445 | -28.67 | 126.01 | A0 DF DR P1 |
| 2121801 | 18-Dec-2002 | 00:49:04 | 00:50:10 | 00:52:20 | 196 | 492 | 234072 | 12-25 | -5 | -431 | 431 | -27.73 | 124.79 | A0 DF DR P1 |
| 2121833 | 18-Dec-2002 | 00:52:56 | 00:53:58 | 00:54:56 | 120 | 264 | 109368 | 12-25 | -12 | -432 | 432 | -27.80 | 124.29 | A0 DF DR P1 |
| 2121852 | 18-Dec-2002 | 00:58:08 | 01:01:18 | 01:04:08 | 360 | 252 | 348336 | 6-12 | -1 | -437 | 437 | -28.13 | 124.96 | A0 DF DR P1 |
| 2121899 | 18-Dec-2002 | 01:04:08 | 01:05:58 | 01:08:16 | 248 | 192 | 239616 | 6-12 | -1 | -448 | 448 | -28.87 | 124.91 | A0 DF DR P1 |
| 21218100 | 18-Dec-2002 | 01:08:16 | 01:10:10 | 01:17:16 | 540 | 228 | 499968 | 6-12 | -1 | -446 | 446 | -28.74 | 124.88 | A0 DF DR P1 |
| 2121853 | 18-Dec-2002 | 01:23:04 | 01:24:26 | 01:25:20 | 136 | 69 | 45144 | 6-12 | 51 | -419 | 422 | -26.94 | 128.22 | A0 DF P1 |
| 2121854 | 18-Dec-2002 | 01:34:12 | 01:37:50 | 01:38:20 | 248 | 126 | 91584 | 6-12 | -2 | -437 | 437 | -28.14 | 124.56 | A0 DF DR P1 |
| 2121855 | 18-Dec-2002 | 02:14:40 | 02:32:38 | 02:49:04 | 2064 | 288 | 338888 | 12-25 | 2 | -437 | 437 | -28.14 | 124.32 | a0 A1 DF DR GD GE P1 PE |
| 2121804 | 18-Dec-2002 | 03:03:20 | 03:03:42 | 03:09:08 | 348 | 14 | 16037 | 12-25 | 13 | -441 | 441 | -28.41 | 124.79 | A0 DF DR P1 |
| 21218101 | 18-Dec-2002 | 03:09:08 | 03:10:34 | 03:14:36 | 328 | 5 | 5381 | 6-12 | 19 | -448 | 448 | -28.88 | 125.13 | A0 DF DR P1 |
| 2121837 | 18-Dec-2002 | 04:04:32 | 04:04:38 | 04:07:16 | 164 | 352 | 125616 | 12-25 | 28 | -420 | 421 | -27.02 | 125.22 | A0 DF DR GS P1 PE |
| 21218102 | 18-Dec-2002 | 04:07:16 | 04:08:34 | 04:10:40 | 204 | 92 | 74400 | 6-12 | 39 | -431 | 433 | -27.75 | 125.94 | A0 DF DR P1 PE |
| 2121836 | 18-Dec-2002 | 04:10:40 | 04:12:14 | 04:18:44 | 484 | 152 | 160800 | 12-25 | 16 | -427 | 428 | -27.48 | 124.35 | A0 DF DR P1 |
| Date | Start | Peak | End | Classification | B [deg] | LCM [deg] |
|---|---|---|---|---|---|---|
| 17-Dec-2002 | 22:57 | 23:35 | 23:45 | M1.6 | -27 | -00 |
| 18-Dec-2002 | 02:29 | 02:33 | 02:36 | C6.9 | -27 | -00 |

