move the mouse pointer over that image.
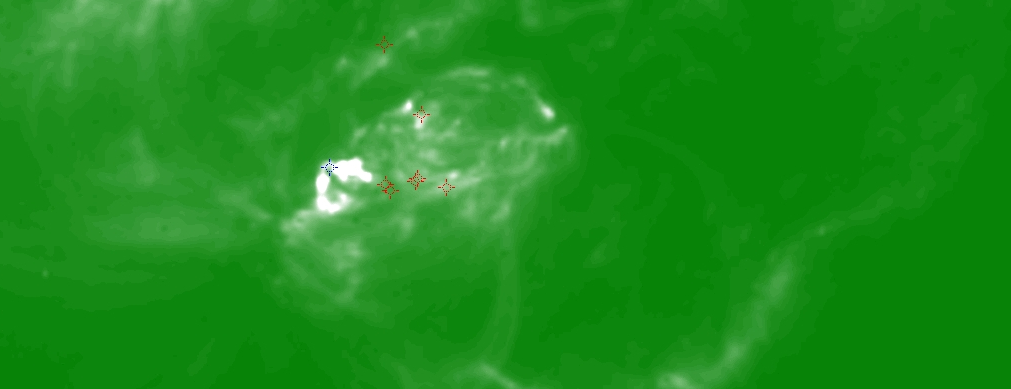
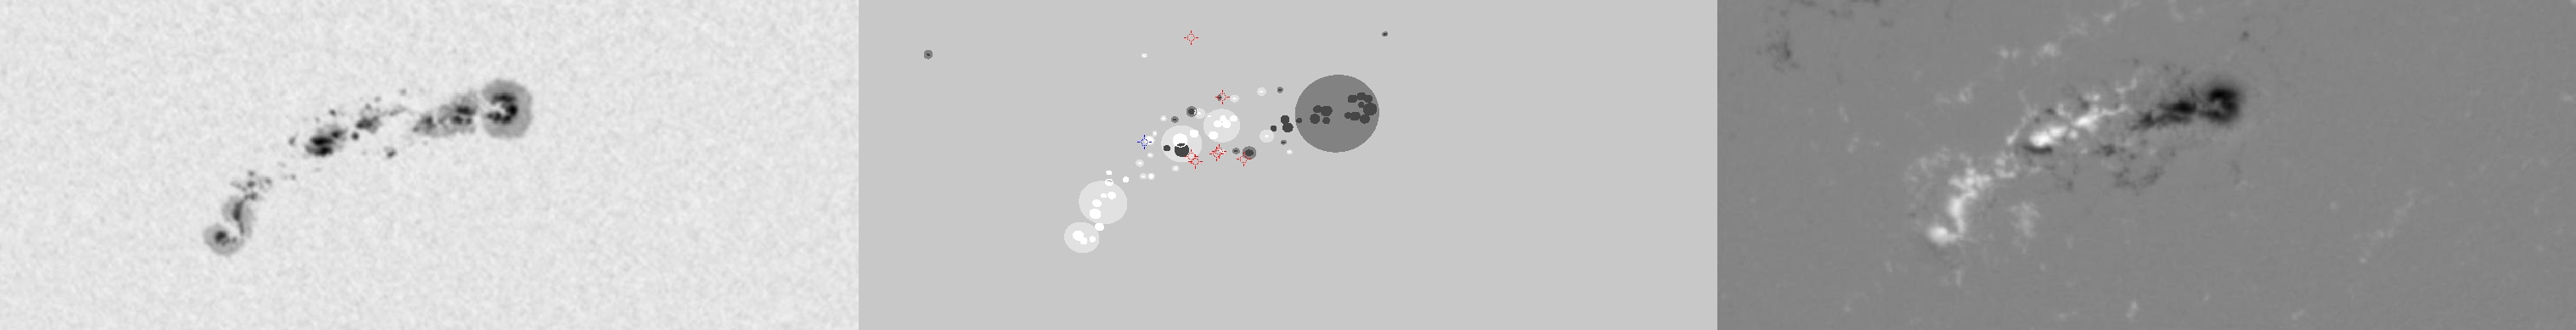
| Evolution of sunspot group NOAA 10226 and positions of flares in it animated by using the data of SOHO/MDI Debrecen Data (SDD) sunspot catalogue (lower panel, middle, ellipses with positions and areas corresponding to the relevant data of spots in SDD and with grey-scale colour coding of the magnetic polarities corresponding to that of the magnetograms), SOHO/MDI continuum images (lower panel, left) and magnetograms (lower panel, right), SOHO/EIT images (upper panel, middle), GOES and RHESSI flare data (red and blue symbols) observed within the interval around the time of SDD data. |
|
When you want to zoom in on one of the images, simply move the mouse pointer over that image. |
 |
| Year | Month | Day | Hour | Min | Sec | NOAA | Proj.U | Proj.WS | Corr.U | Corr.WS | B | L | LCM | Pos.angle | r | MU | MP |
|---|---|---|---|---|---|---|---|---|---|---|---|---|---|---|---|---|---|
| 2002 | 12 | 17 | 19 | 56 | 32 | 10226 | 352 | 1963 | 196 | 1085 | -26.92 | 128.91 | -0.08 | 180.68 | 0.4421 | -134.9 | -27.7 |
| Flare | Date | Start | Peak | End | Dur [s] | Peak [c/s] | Total Counts | Energy [keV] | X pos [asec] | Y pos [asec] | Radial [asec] | B [deg] | L [deg] | Flags |
|---|---|---|---|---|---|---|---|---|---|---|---|---|---|---|
| 2121789 | 17-Dec-2002 | 16:36:52 | 16:39:58 | 16:42:28 | 336 | 72 | 116016 | 6-12 | -69 | -435 | 441 | -27.95 | 124.96 | A0 DF P1 |
| 21217117 | 17-Dec-2002 | 16:42:28 | 16:51:22 | 17:04:04 | 1296 | 1648 | 5330496 | 12-25 | -69 | -431 | 437 | -27.69 | 124.87 | A0 DF DR GE P1 PE |
| 2121714 | 17-Dec-2002 | 17:23:20 | 17:23:50 | 17:25:24 | 124 | 80 | 47808 | 6-12 | -40 | -427 | 429 | -27.43 | 126.53 | A0 DF GS P1 |
| 21217118 | 17-Dec-2002 | 17:25:24 | 17:26:18 | 17:33:00 | 456 | 84 | 133056 | 6-12 | -21 | -433 | 433 | -27.83 | 127.78 | A0 DF P1 |
| 21217119 | 17-Dec-2002 | 17:33:00 | 17:36:38 | 17:37:00 | 240 | 68 | 65496 | 6-12 | -38 | -429 | 430 | -27.56 | 126.54 | A0 DF P1 |
| 2121794 | 17-Dec-2002 | 19:09:32 | 19:12:14 | 19:12:52 | 200 | 4 | 4287 | 6-12 | -8 | -387 | 387 | -24.81 | 127.69 | A0 DF P1 |
| 21217121 | 17-Dec-2002 | 20:08:00 | 20:12:18 | 20:13:52 | 352 | 112 | 195936 | 6-12 | -14 | -343 | 343 | -21.98 | 126.77 | A0 DF DR P1 PE |
| Date | Start | Peak | End | Classification | B [deg] | LCM [deg] |
|---|---|---|---|---|---|---|
| 17-Dec-2002 | 19:23 | 19:30 | 19:39 | C6.4 | -27 | -05 |

