move the mouse pointer over that image.
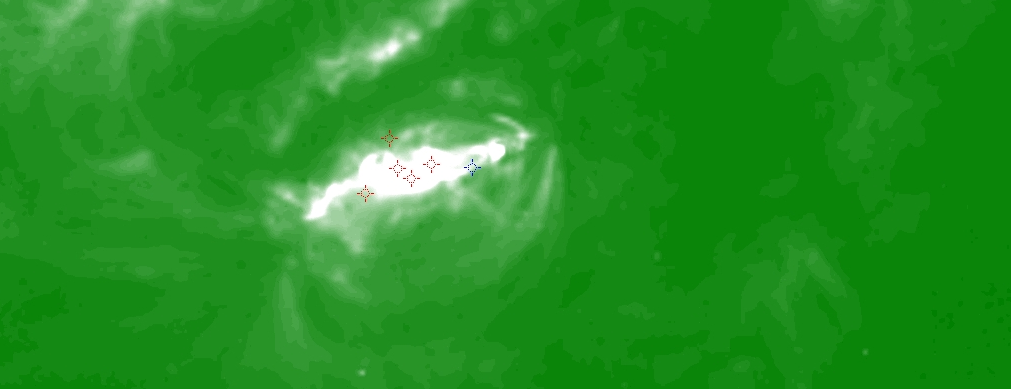
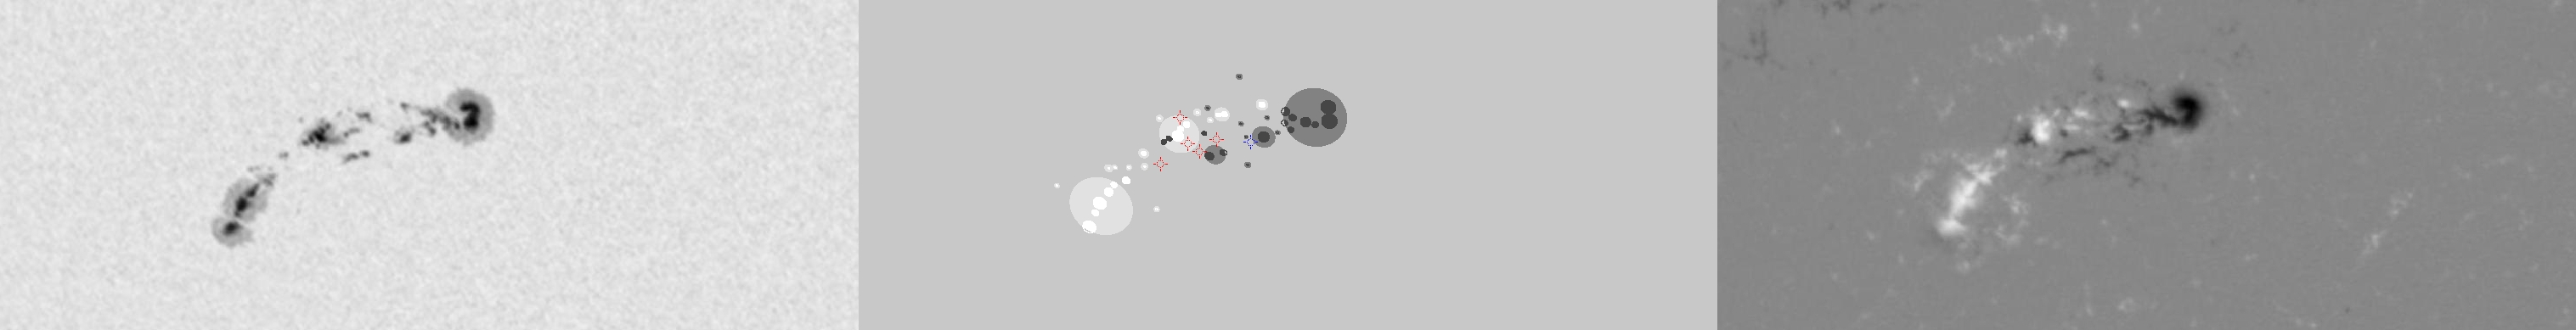
| Evolution of sunspot group NOAA 10226 and positions of flares in it animated by using the data of SOHO/MDI Debrecen Data (SDD) sunspot catalogue (lower panel, middle, ellipses with positions and areas corresponding to the relevant data of spots in SDD and with grey-scale colour coding of the magnetic polarities corresponding to that of the magnetograms), SOHO/MDI continuum images (lower panel, left) and magnetograms (lower panel, right), SOHO/EIT images (upper panel, middle), GOES and RHESSI flare data (red and blue symbols) observed within the interval around the time of SDD data. |
|
When you want to zoom in on one of the images, simply move the mouse pointer over that image. |
 |
| Year | Month | Day | Hour | Min | Sec | NOAA | Proj.U | Proj.WS | Corr.U | Corr.WS | B | L | LCM | Pos.angle | r | MU | MP |
|---|---|---|---|---|---|---|---|---|---|---|---|---|---|---|---|---|---|
| 2002 | 12 | 16 | 22 | 23 | 32 | 10226 | 276 | 1518 | 159 | 866 | -27.52 | 128.06 | -12.76 | 157.13 | 0.4901 | -157.9 | 25.1 |
| Flare | Date | Start | Peak | End | Dur [s] | Peak [c/s] | Total Counts | Energy [keV] | X pos [asec] | Y pos [asec] | Radial [asec] | B [deg] | L [deg] | Flags |
|---|---|---|---|---|---|---|---|---|---|---|---|---|---|---|
| 21216118 | 16-Dec-2002 | 21:46:48 | 21:48:22 | 21:51:52 | 304 | 96 | 56544 | 6-12 | -171 | -420 | 453 | -26.84 | 128.49 | A0 DF DR P1 |
| 2121693 | 16-Dec-2002 | 21:54:28 | 21:55:10 | 21:57:24 | 176 | 36 | 33072 | 6-12 | -190 | -423 | 464 | -27.04 | 127.10 | A0 DF P1 |
| 21216119 | 16-Dec-2002 | 21:57:24 | 21:59:34 | 21:59:44 | 140 | 38 | 27120 | 6-12 | -189 | -423 | 463 | -27.04 | 127.13 | A0 DF P1 |
| 2121639 | 16-Dec-2002 | 21:59:44 | 22:04:42 | 22:10:00 | 616 | 320 | 303936 | 12-25 | -193 | -404 | 448 | -25.78 | 126.95 | A0 DF P1 |
| 21216120 | 16-Dec-2002 | 22:10:00 | 22:12:22 | 22:22:00 | 720 | 168 | 366528 | 6-12 | -177 | -429 | 465 | -27.44 | 127.79 | A0 DF DR P1 |
| 2121633 | 16-Dec-2002 | 22:58:04 | 22:58:30 | 23:44:24 | 2780 | 820 | 2218553 | 6-12 | -194 | -438 | 479 | -28.04 | 126.13 | A0 a1 DF DR ES P1 PE |
| Date | Start | Peak | End | Classification | B [deg] | LCM [deg] |
|---|---|---|---|---|---|---|
| 16-Dec-2002 | 22:45 | 22:55 | 23:20 | M1.9 | -27 | -10 |

