
move the mouse pointer over that image.
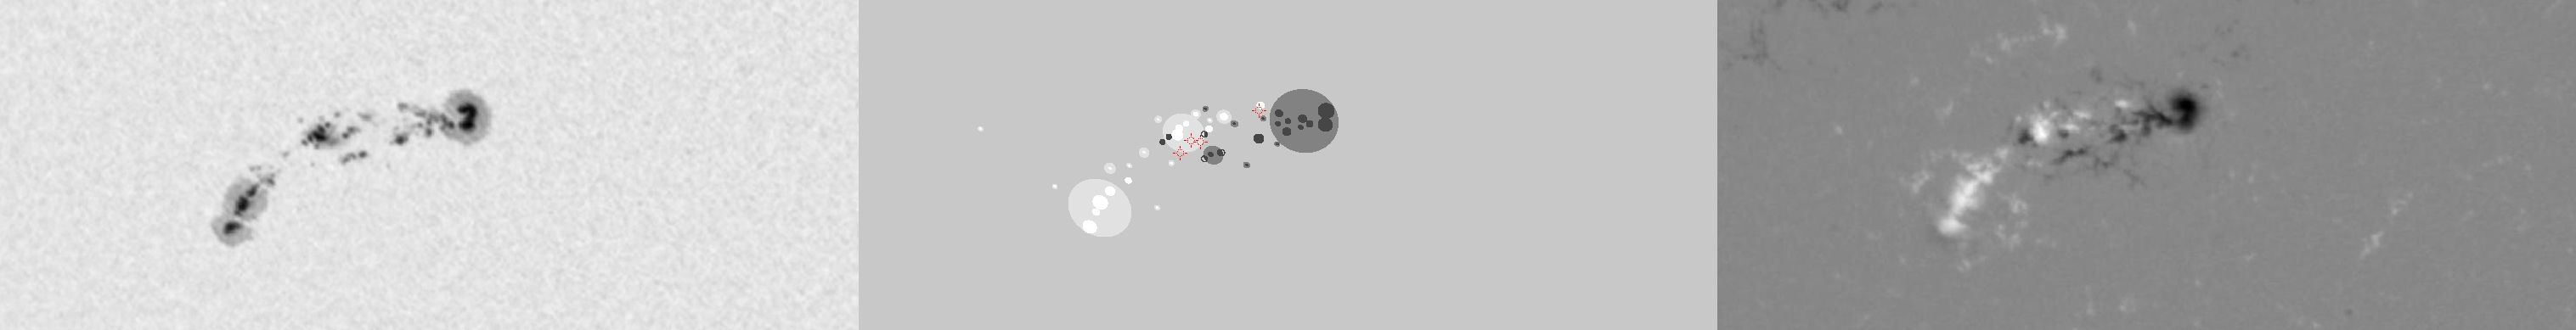
| Evolution of sunspot group NOAA 10226 and positions of flares in it animated by using the data of SOHO/MDI Debrecen Data (SDD) sunspot catalogue (lower panel, middle, ellipses with positions and areas corresponding to the relevant data of spots in SDD and with grey-scale colour coding of the magnetic polarities corresponding to that of the magnetograms), SOHO/MDI continuum images (lower panel, left) and magnetograms (lower panel, right), SOHO/EIT images (upper panel, middle), GOES and RHESSI flare data (red and blue symbols) observed within the interval around the time of SDD data. |
|
When you want to zoom in on one of the images, simply move the mouse pointer over that image. |
 |
| Year | Month | Day | Hour | Min | Sec | NOAA | Proj.U | Proj.WS | Corr.U | Corr.WS | B | L | LCM | Pos.angle | r | MU | MP |
|---|---|---|---|---|---|---|---|---|---|---|---|---|---|---|---|---|---|
| 2002 | 12 | 16 | 20 | 47 | 32 | 10226 | 270 | 1544 | 154 | 881 | -27.55 | 128.01 | -13.69 | 155.65 | 0.4963 | -103.6 | 32.5 |
| Flare | Date | Start | Peak | End | Dur [s] | Peak [c/s] | Total Counts | Energy [keV] | X pos [asec] | Y pos [asec] | Radial [asec] | B [deg] | L [deg] | Flags |
|---|---|---|---|---|---|---|---|---|---|---|---|---|---|---|
| 21216117 | 16-Dec-2002 | 19:57:16 | 20:02:02 | 20:08:32 | 676 | 848 | 850320 | 12-25 | -154 | -399 | 428 | -25.45 | 130.74 | A0 DF DR P1 |
| 2121689 | 16-Dec-2002 | 20:08:32 | 20:14:06 | 20:22:24 | 832 | 192 | 390096 | 6-12 | -194 | -422 | 464 | -26.96 | 127.76 | A0 DF DR P1 |
| 2121637 | 16-Dec-2002 | 20:40:48 | 20:41:26 | 20:46:08 | 320 | 108 | 164448 | 6-12 | -194 | -421 | 464 | -26.90 | 127.52 | A0 DF DR P1 |
| 2121638 | 16-Dec-2002 | 21:21:48 | 21:22:22 | 21:46:48 | 1500 | 848 | 1703088 | 6-12 | -191 | -430 | 471 | -27.50 | 127.28 | A0 DF DR ES P1 |
| Date | Start | Peak | End | Classification | B [deg] | LCM [deg] |
|---|---|---|---|---|---|---|
| No data |

