move the mouse pointer over that image.
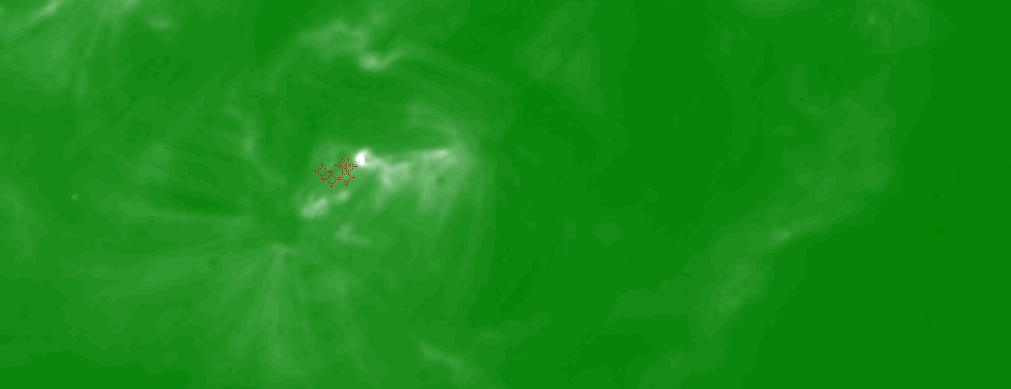
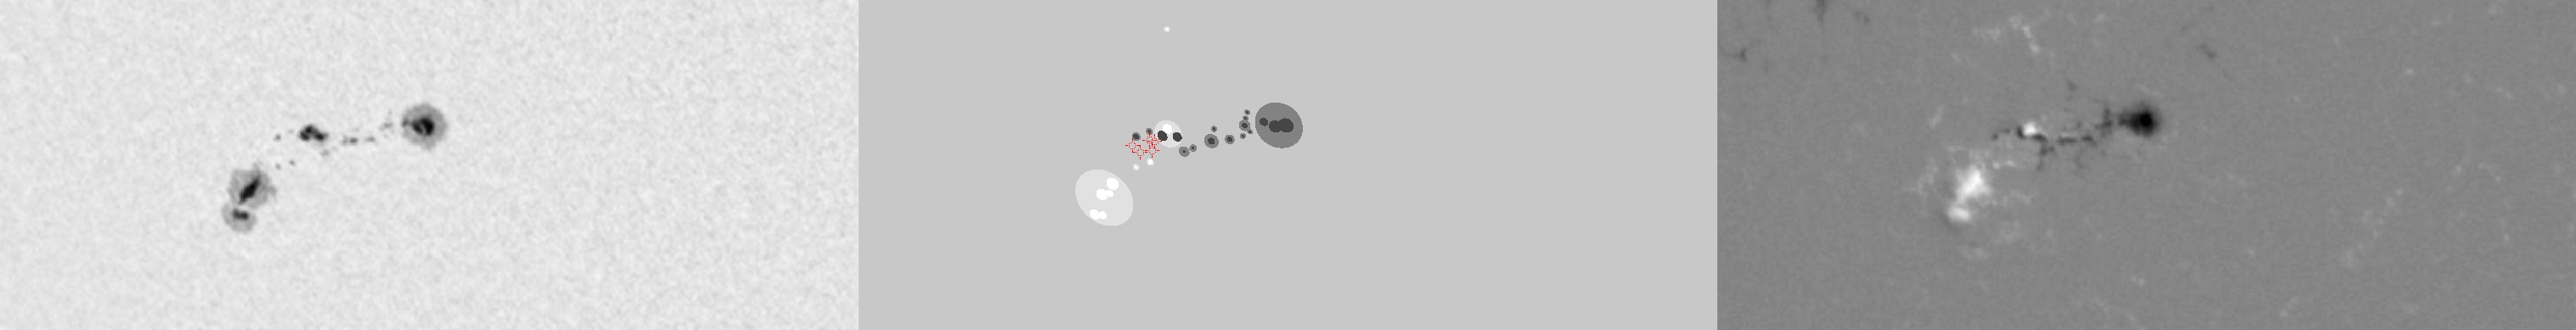
| Evolution of sunspot group NOAA 10226 and positions of flares in it animated by using the data of SOHO/MDI Debrecen Data (SDD) sunspot catalogue (lower panel, middle, ellipses with positions and areas corresponding to the relevant data of spots in SDD and with grey-scale colour coding of the magnetic polarities corresponding to that of the magnetograms), SOHO/MDI continuum images (lower panel, left) and magnetograms (lower panel, right), SOHO/EIT images (upper panel, middle), GOES and RHESSI flare data (red and blue symbols) observed within the interval around the time of SDD data. |
|
When you want to zoom in on one of the images, simply move the mouse pointer over that image. |
 |
| Year | Month | Day | Hour | Min | Sec | NOAA | Proj.U | Proj.WS | Corr.U | Corr.WS | B | L | LCM | Pos.angle | r | MU | MP |
|---|---|---|---|---|---|---|---|---|---|---|---|---|---|---|---|---|---|
| 2002 | 12 | 15 | 23 | 59 | 32 | 10226 | 163 | 979 | 100 | 602 | -27.91 | 127.23 | -25.89 | 140.06 | 0.5971 | -81.7 | 63.5 |
| Flare | Date | Start | Peak | End | Dur [s] | Peak [c/s] | Total Counts | Energy [keV] | X pos [asec] | Y pos [asec] | Radial [asec] | B [deg] | L [deg] | Flags |
|---|---|---|---|---|---|---|---|---|---|---|---|---|---|---|
| 2121564 | 15-Dec-2002 | 23:18:48 | 23:21:26 | 23:23:12 | 264 | 62 | 72999 | 6-12 | -380 | -431 | 575 | -27.39 | 125.89 | A0 DF DR P1 |
| 2121597 | 15-Dec-2002 | 23:23:12 | 23:25:18 | 23:31:28 | 496 | 328 | 235174 | 12-25 | -381 | -423 | 570 | -26.86 | 125.91 | A0 DF DR P1 |
| 2121517 | 15-Dec-2002 | 23:31:28 | 23:33:14 | 23:34:52 | 204 | 63 | 51270 | 6-12 | -386 | -432 | 580 | -27.46 | 125.31 | A0 DF P1 |
| 2121598 | 15-Dec-2002 | 23:34:52 | 23:54:46 | 23:55:20 | 1228 | 848 | 1345343 | 12-25 | -370 | -424 | 563 | -26.93 | 126.44 | A0 DF DR EE P1 |
| 2121624 | 16-Dec-2002 | 00:30:40 | 00:31:22 | 00:36:24 | 344 | 528 | 484848 | 6-12 | -378 | -427 | 570 | -27.13 | 125.47 | A0 DF ES P1 |
| Date | Start | Peak | End | Classification | B [deg] | LCM [deg] |
|---|---|---|---|---|---|---|
| No data |

