move the mouse pointer over that image.
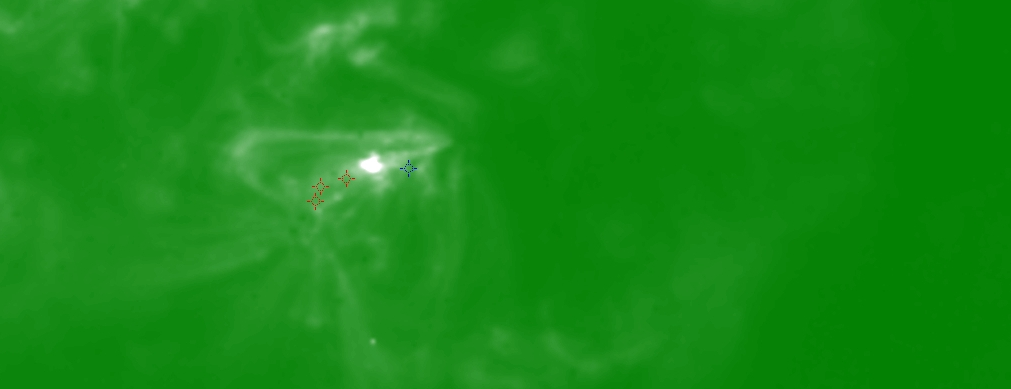
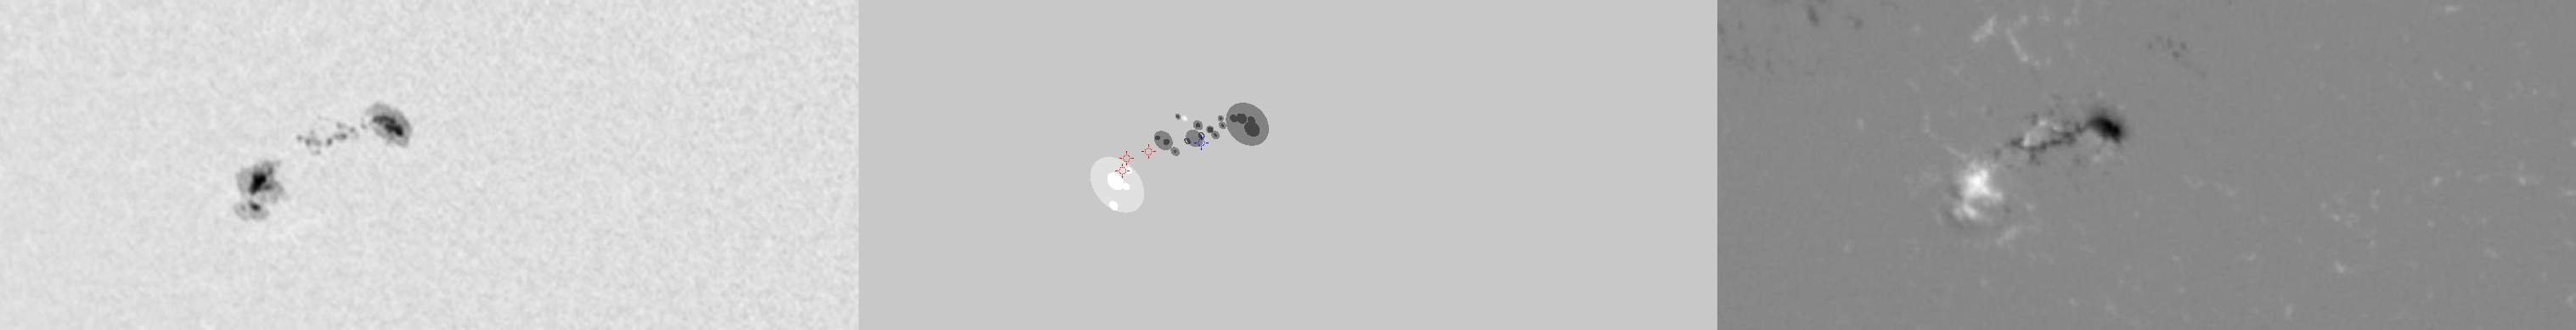
| Evolution of sunspot group NOAA 10226 and positions of flares in it animated by using the data of SOHO/MDI Debrecen Data (SDD) sunspot catalogue (lower panel, middle, ellipses with positions and areas corresponding to the relevant data of spots in SDD and with grey-scale colour coding of the magnetic polarities corresponding to that of the magnetograms), SOHO/MDI continuum images (lower panel, left) and magnetograms (lower panel, right), SOHO/EIT images (upper panel, middle), GOES and RHESSI flare data (red and blue symbols) observed within the interval around the time of SDD data. |
|
When you want to zoom in on one of the images, simply move the mouse pointer over that image. |
 |
| Year | Month | Day | Hour | Min | Sec | NOAA | Proj.U | Proj.WS | Corr.U | Corr.WS | B | L | LCM | Pos.angle | r | MU | MP |
|---|---|---|---|---|---|---|---|---|---|---|---|---|---|---|---|---|---|
| 2002 | 12 | 15 | 09 | 59 | 32 | 10226 | 131 | 794 | 85 | 527 | -27.71 | 127.36 | -33.45 | 133.05 | 0.6668 | -74.4 | 53.1 |
| Flare | Date | Start | Peak | End | Dur [s] | Peak [c/s] | Total Counts | Energy [keV] | X pos [asec] | Y pos [asec] | Radial [asec] | B [deg] | L [deg] | Flags |
|---|---|---|---|---|---|---|---|---|---|---|---|---|---|---|
| 2121547 | 15-Dec-2002 | 08:59:04 | 08:59:50 | 09:11:52 | 768 | 128 | 224496 | 6-12 | -499 | -438 | 664 | -27.73 | 124.31 | A0 DF DR GS P1 PE |
| 21215104 | 15-Dec-2002 | 09:11:52 | 09:13:30 | 09:18:36 | 404 | 26 | 42432 | 6-12 | -499 | -447 | 670 | -28.34 | 123.95 | A0 DF P1 |
| 2121575 | 15-Dec-2002 | 09:24:24 | 09:25:14 | 09:27:04 | 160 | 28 | 19416 | 6-12 | -477 | -433 | 645 | -27.41 | 125.99 | A0 DF P1 |
| Date | Start | Peak | End | Classification | B [deg] | LCM [deg] |
|---|---|---|---|---|---|---|
| 15-Dec-2002 | 10:17 | 10:29 | 10:41 | C2.8 | -27 | -31 |

