move the mouse pointer over that image.
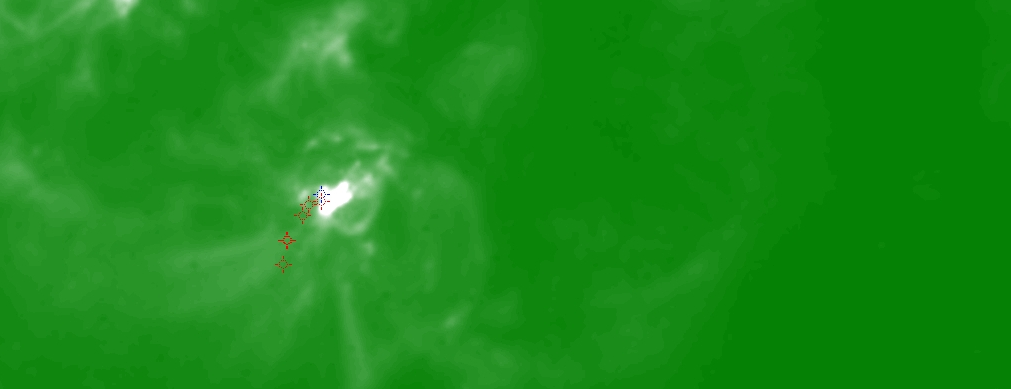
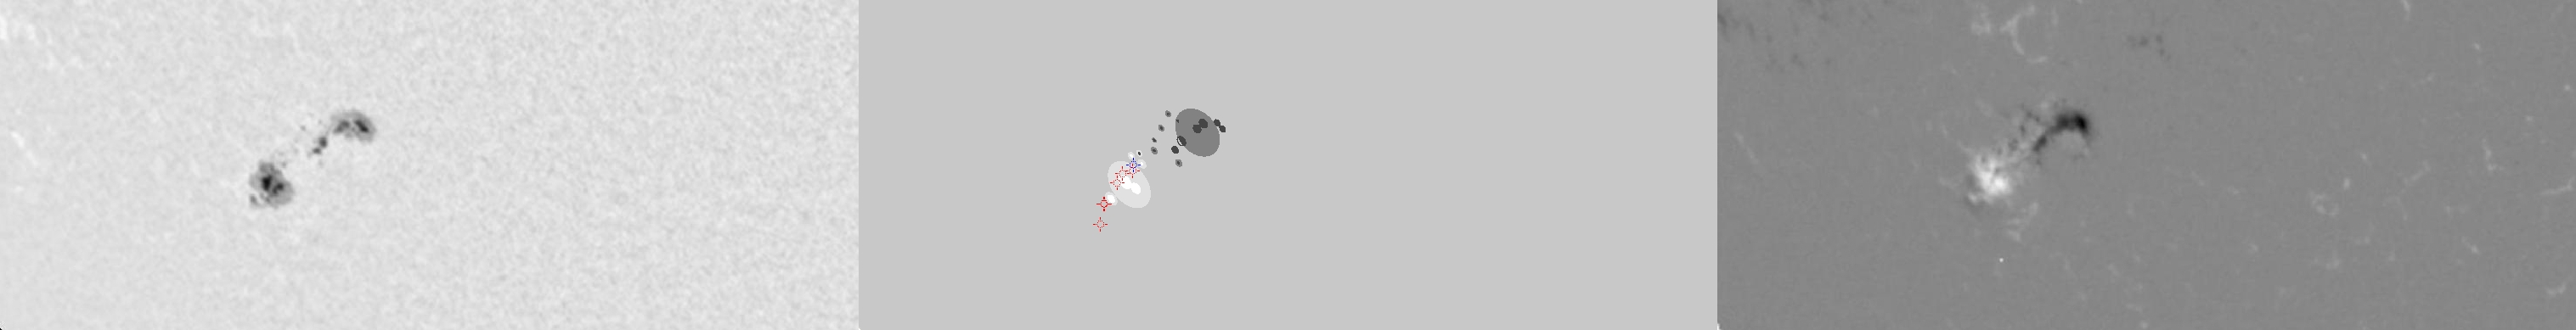
| Evolution of sunspot group NOAA 10226 and positions of flares in it animated by using the data of SOHO/MDI Debrecen Data (SDD) sunspot catalogue (lower panel, middle, ellipses with positions and areas corresponding to the relevant data of spots in SDD and with grey-scale colour coding of the magnetic polarities corresponding to that of the magnetograms), SOHO/MDI continuum images (lower panel, left) and magnetograms (lower panel, right), SOHO/EIT images (upper panel, middle), GOES and RHESSI flare data (red and blue symbols) observed within the interval around the time of SDD data. |
|
When you want to zoom in on one of the images, simply move the mouse pointer over that image. |
 |
| Year | Month | Day | Hour | Min | Sec | NOAA | Proj.U | Proj.WS | Corr.U | Corr.WS | B | L | LCM | Pos.angle | r | MU | MP |
|---|---|---|---|---|---|---|---|---|---|---|---|---|---|---|---|---|---|
| 2002 | 12 | 14 | 20 | 47 | 32 | 10226 | 86 | 613 | 64 | 450 | -27.71 | 127.25 | -40.81 | 128.23 | 0.7372 | 4.9 | 46.3 |
| Flare | Date | Start | Peak | End | Dur [s] | Peak [c/s] | Total Counts | Energy [keV] | X pos [asec] | Y pos [asec] | Radial [asec] | B [deg] | L [deg] | Flags |
|---|---|---|---|---|---|---|---|---|---|---|---|---|---|---|
| 21214141 | 14-Dec-2002 | 20:15:52 | 20:16:46 | 20:18:40 | 168 | 28 | 20952 | 6-12 | -583 | -457 | 741 | -28.90 | 123.33 | A0 DF P1 PE |
| 21214119 | 14-Dec-2002 | 20:27:12 | 20:27:18 | 20:28:52 | 100 | 56 | 27840 | 6-12 | -577 | -450 | 732 | -28.44 | 124.04 | A0 DF GS P1 |
| 21214142 | 14-Dec-2002 | 20:28:52 | 20:33:14 | 20:39:12 | 620 | 1392 | 2078880 | 12-25 | -568 | -448 | 724 | -28.31 | 124.88 | A0 DF DR P1 |
| 2121487 | 14-Dec-2002 | 21:14:56 | 21:15:18 | 21:19:28 | 272 | 60 | 71352 | 6-12 | -585 | -487 | 761 | -30.95 | 121.44 | A0 DF P1 |
| 21214143 | 14-Dec-2002 | 21:19:28 | 21:21:58 | 21:28:04 | 516 | 56 | 122592 | 6-12 | -581 | -472 | 748 | -29.92 | 122.37 | A0 DF DR P1 |
| 21214144 | 14-Dec-2002 | 21:28:04 | 21:30:06 | 21:33:48 | 344 | 48 | 58560 | 6-12 | -579 | -472 | 747 | -29.93 | 122.49 | A0 DF DR P1 PE |
| Date | Start | Peak | End | Classification | B [deg] | LCM [deg] |
|---|---|---|---|---|---|---|
| 14-Dec-2002 | 20:30 | 20:35 | 20:58 | C2.1 | -28 | -43 |

