move the mouse pointer over that image.
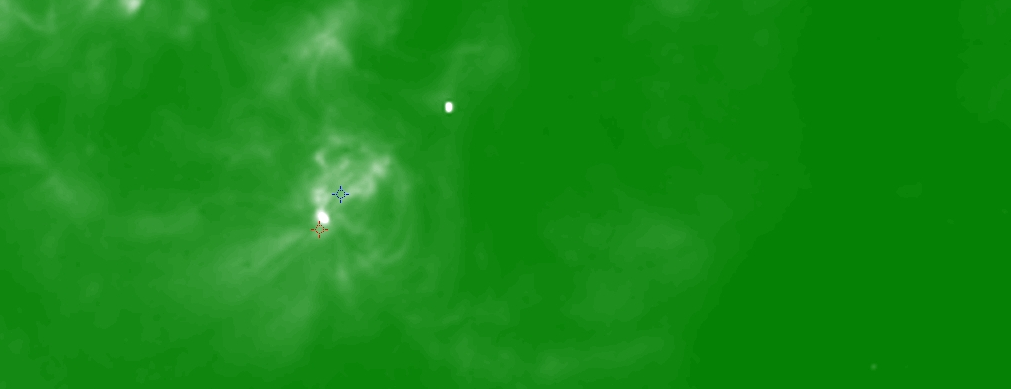
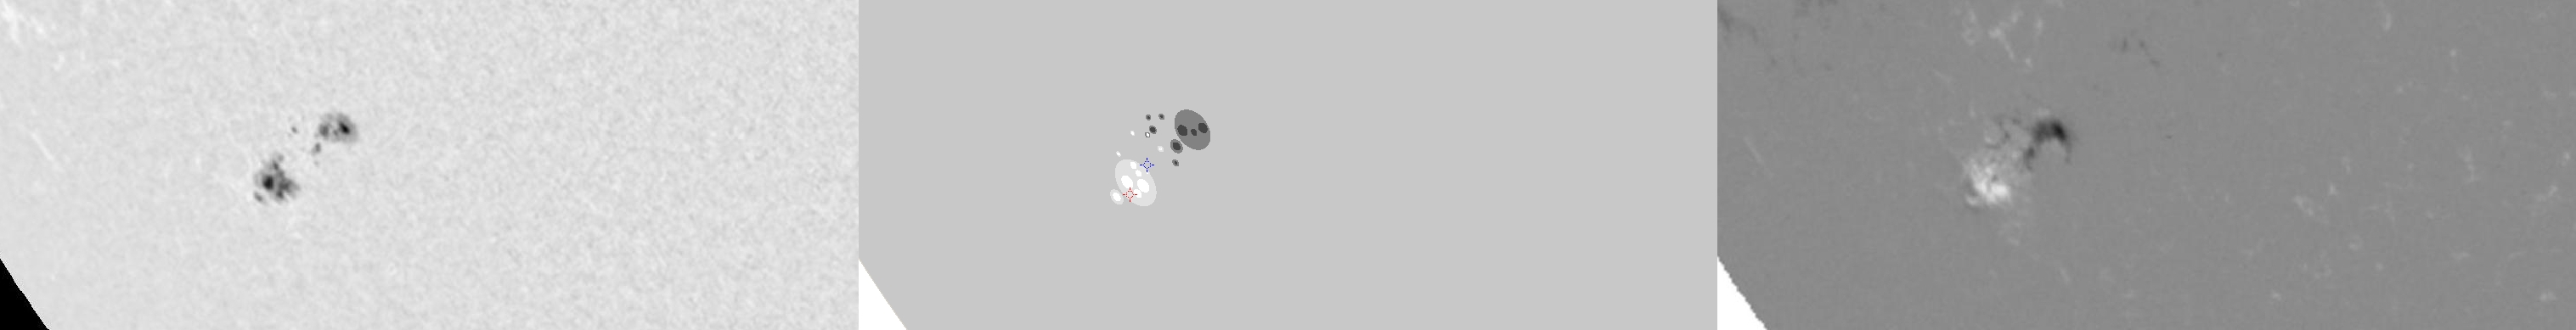
| Evolution of sunspot group NOAA 10226 and positions of flares in it animated by using the data of SOHO/MDI Debrecen Data (SDD) sunspot catalogue (lower panel, middle, ellipses with positions and areas corresponding to the relevant data of spots in SDD and with grey-scale colour coding of the magnetic polarities corresponding to that of the magnetograms), SOHO/MDI continuum images (lower panel, left) and magnetograms (lower panel, right), SOHO/EIT images (upper panel, middle), GOES and RHESSI flare data (red and blue symbols) observed within the interval around the time of SDD data. |
|
When you want to zoom in on one of the images, simply move the mouse pointer over that image. |
 |
| Year | Month | Day | Hour | Min | Sec | NOAA | Proj.U | Proj.WS | Corr.U | Corr.WS | B | L | LCM | Pos.angle | r | MU | MP |
|---|---|---|---|---|---|---|---|---|---|---|---|---|---|---|---|---|---|
| 2002 | 12 | 14 | 14 | 55 | 32 | 10226 | 98 | 517 | 76 | 399 | -27.79 | 127.12 | -44.16 | 126.58 | 0.7685 | 264.5 | 66.1 |
| Flare | Date | Start | Peak | End | Dur [s] | Peak [c/s] | Total Counts | Energy [keV] | X pos [asec] | Y pos [asec] | Radial [asec] | B [deg] | L [deg] | Flags |
|---|---|---|---|---|---|---|---|---|---|---|---|---|---|---|
| 21214133 | 14-Dec-2002 | 13:22:08 | 13:23:30 | 13:27:36 | 328 | 144 | 144336 | 6-12 | -619 | -466 | 775 | -29.46 | 123.26 | A0 |
| 21214135 | 14-Dec-2002 | 14:55:40 | 15:00:30 | 15:06:52 | 672 | 2288 | 3600576 | 12-25 | -887 | 309 | 939 | 18.62 | 92.85 | A0 |
| 2121479 | 14-Dec-2002 | 15:06:52 | 15:08:34 | 15:12:12 | 320 | 1008 | 1007856 | 12-25 | -648 | 422 | 774 | 25.56 | 121.65 | A0 GE P1 PE |
| Date | Start | Peak | End | Classification | B [deg] | LCM [deg] |
|---|---|---|---|---|---|---|
| 14-Dec-2002 | 14:57 | 15:04 | 15:12 | C2.9 | -28 | -45 |

