
move the mouse pointer over that image.
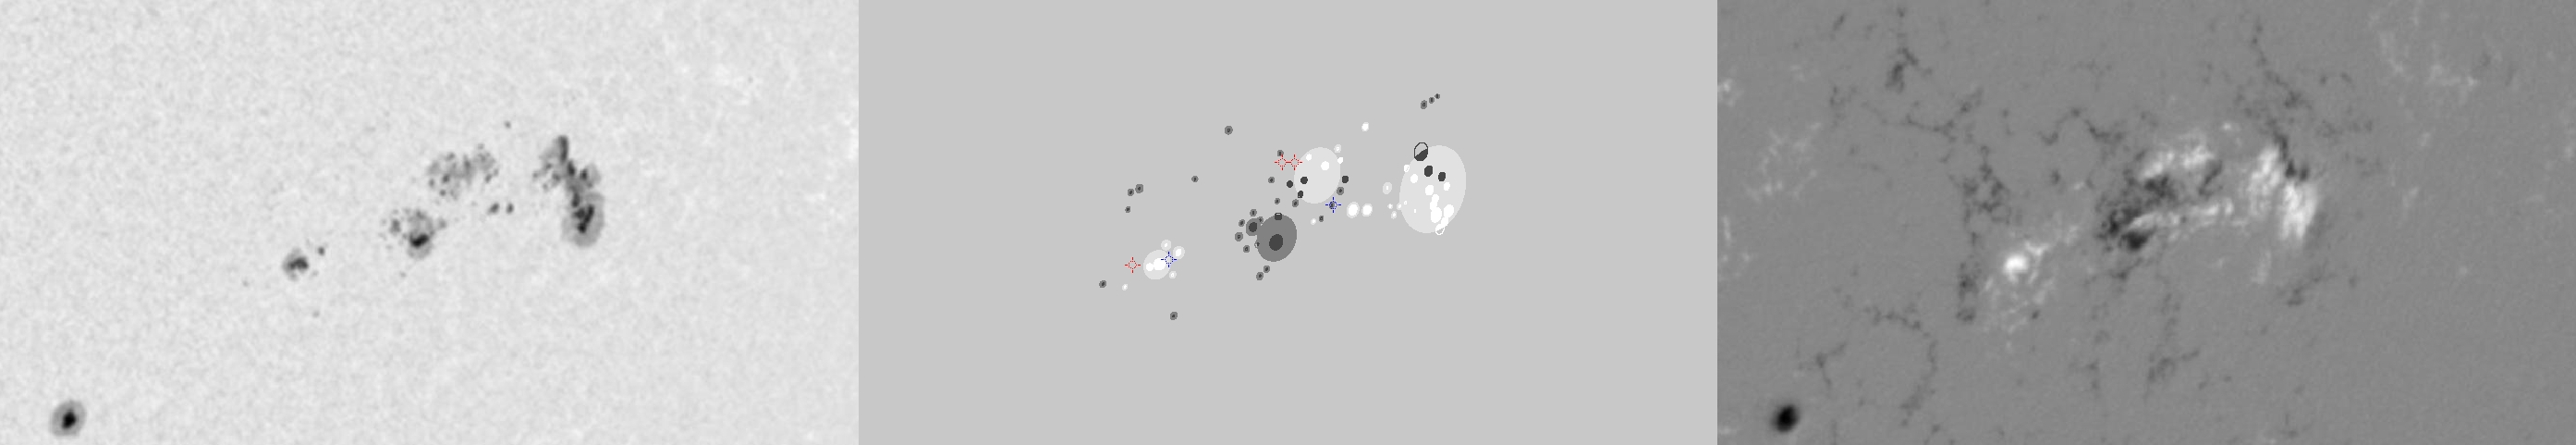
| Evolution of sunspot group NOAA 10180 and positions of flares in it animated by using the data of SOHO/MDI Debrecen Data (SDD) sunspot catalogue (lower panel, middle, ellipses with positions and areas corresponding to the relevant data of spots in SDD and with grey-scale colour coding of the magnetic polarities corresponding to that of the magnetograms), SOHO/MDI continuum images (lower panel, left) and magnetograms (lower panel, right), SOHO/EIT images (upper panel, middle), GOES and RHESSI flare data (red and blue symbols) observed within the interval around the time of SDD data. |
|
When you want to zoom in on one of the images, simply move the mouse pointer over that image. |
 |
| Year | Month | Day | Hour | Min | Sec | NOAA | Proj.U | Proj.WS | Corr.U | Corr.WS | B | L | LCM | Pos.angle | r | MU | MP |
|---|---|---|---|---|---|---|---|---|---|---|---|---|---|---|---|---|---|
| 2002 | 11 | 09 | 15 | 24 | 33 | 10180 | 249 | 1584 | 165 | 1045 | -9.75 | 311.28 | 38.99 | 250.61 | 0.6578 | 310.2 | 207.9 |
| Flare | Date | Start | Peak | End | Dur [s] | Peak [c/s] | Total Counts | Energy [keV] | X pos [asec] | Y pos [asec] | Radial [asec] | B [deg] | L [deg] | Flags |
|---|---|---|---|---|---|---|---|---|---|---|---|---|---|---|
| 2110912 | 9-Nov-2002 | 13:07:12 | 13:21:50 | 13:28:40 | 1288 | 3056 | 9681024 | 100-300 | 432 | -255 | 502 | -12.17 | 299.58 | A1 EE P1 |
| 2110913 | 9-Nov-2002 | 14:00:00 | 14:05:34 | 14:09:32 | 572 | 104 | 172848 | 25-50 | 545 | -185 | 576 | -8.14 | 306.74 | A1 |
| 2110967 | 9-Nov-2002 | 14:09:32 | 14:11:34 | 14:26:24 | 1012 | 104 | 140472 | 12-25 | 555 | -185 | 585 | -8.16 | 307.43 | A1 |
| Date | Start | Peak | End | Classification | B [deg] | LCM [deg] |
|---|---|---|---|---|---|---|
| 9-Nov-2002 | 13:08 | 13:23 | 13:36 | M4.6 | -12 | 29 |
| 9-Nov-2002 | 15:19 | 15:26 | 15:31 | C4.1 | -10 | 38 |

