move the mouse pointer over that image.
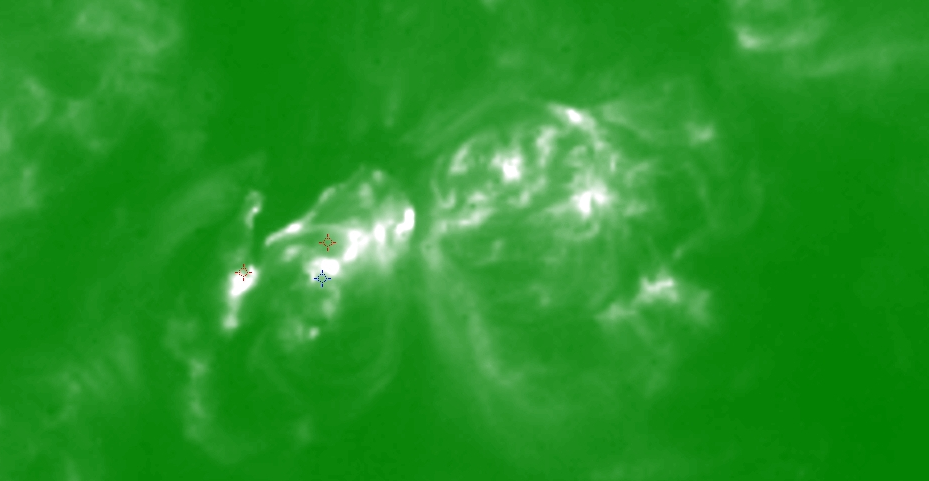
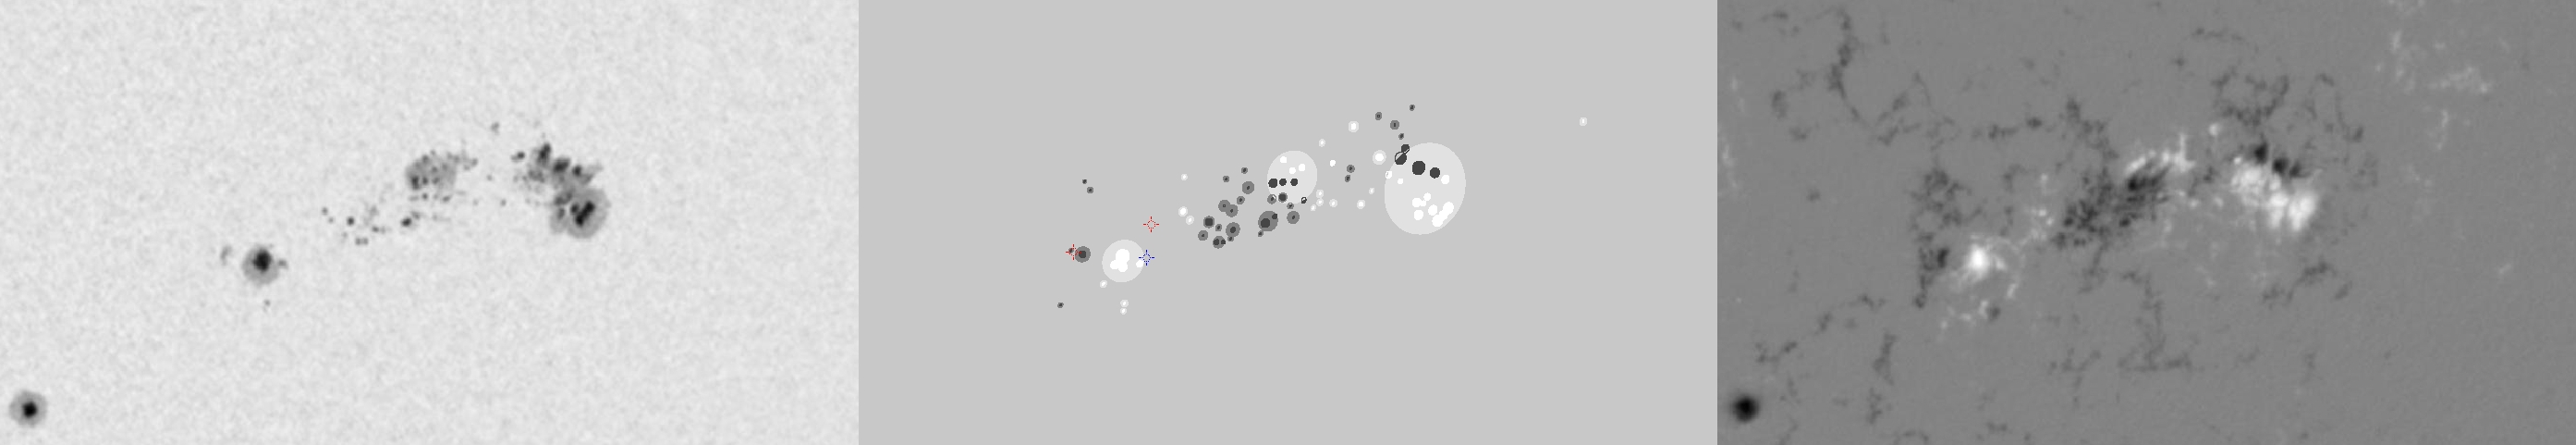
| Evolution of sunspot group NOAA 10180 and positions of flares in it animated by using the data of SOHO/MDI Debrecen Data (SDD) sunspot catalogue (lower panel, middle, ellipses with positions and areas corresponding to the relevant data of spots in SDD and with grey-scale colour coding of the magnetic polarities corresponding to that of the magnetograms), SOHO/MDI continuum images (lower panel, left) and magnetograms (lower panel, right), SOHO/EIT images (upper panel, middle), GOES and RHESSI flare data (red and blue symbols) observed within the interval around the time of SDD data. |
|
When you want to zoom in on one of the images, simply move the mouse pointer over that image. |
 |
| Year | Month | Day | Hour | Min | Sec | NOAA | Proj.U | Proj.WS | Corr.U | Corr.WS | B | L | LCM | Pos.angle | r | MU | MP |
|---|---|---|---|---|---|---|---|---|---|---|---|---|---|---|---|---|---|
| 2002 | 11 | 08 | 17 | 35 | 33 | 10180 | 282 | 1844 | 162 | 1058 | -9.63 | 311.08 | 26.81 | 242.77 | 0.5002 | 283.1 | 230.3 |
| Flare | Date | Start | Peak | End | Dur [s] | Peak [c/s] | Total Counts | Energy [keV] | X pos [asec] | Y pos [asec] | Radial [asec] | B [deg] | L [deg] | Flags |
|---|---|---|---|---|---|---|---|---|---|---|---|---|---|---|
| 2110877 | 8-Nov-2002 | 17:48:40 | 17:49:22 | 17:53:48 | 308 | 18 | 27936 | 12-25 | 273 | -253 | 372 | -11.70 | 299.81 | A1 |
| 2110825 | 8-Nov-2002 | 17:53:48 | 18:11:50 | 18:12:48 | 1140 | 304 | 793848 | 12-25 | 332 | -234 | 406 | -10.61 | 303.31 | A1 |
| Date | Start | Peak | End | Classification | B [deg] | LCM [deg] |
|---|---|---|---|---|---|---|
| 8-Nov-2002 | 17:57 | 18:20 | 18:48 | C7.4 | -12 | 19 |

