move the mouse pointer over that image.
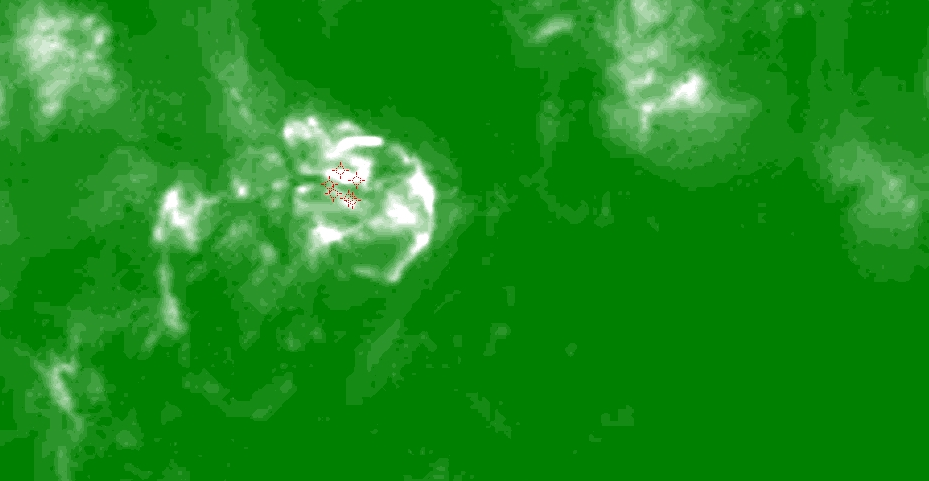
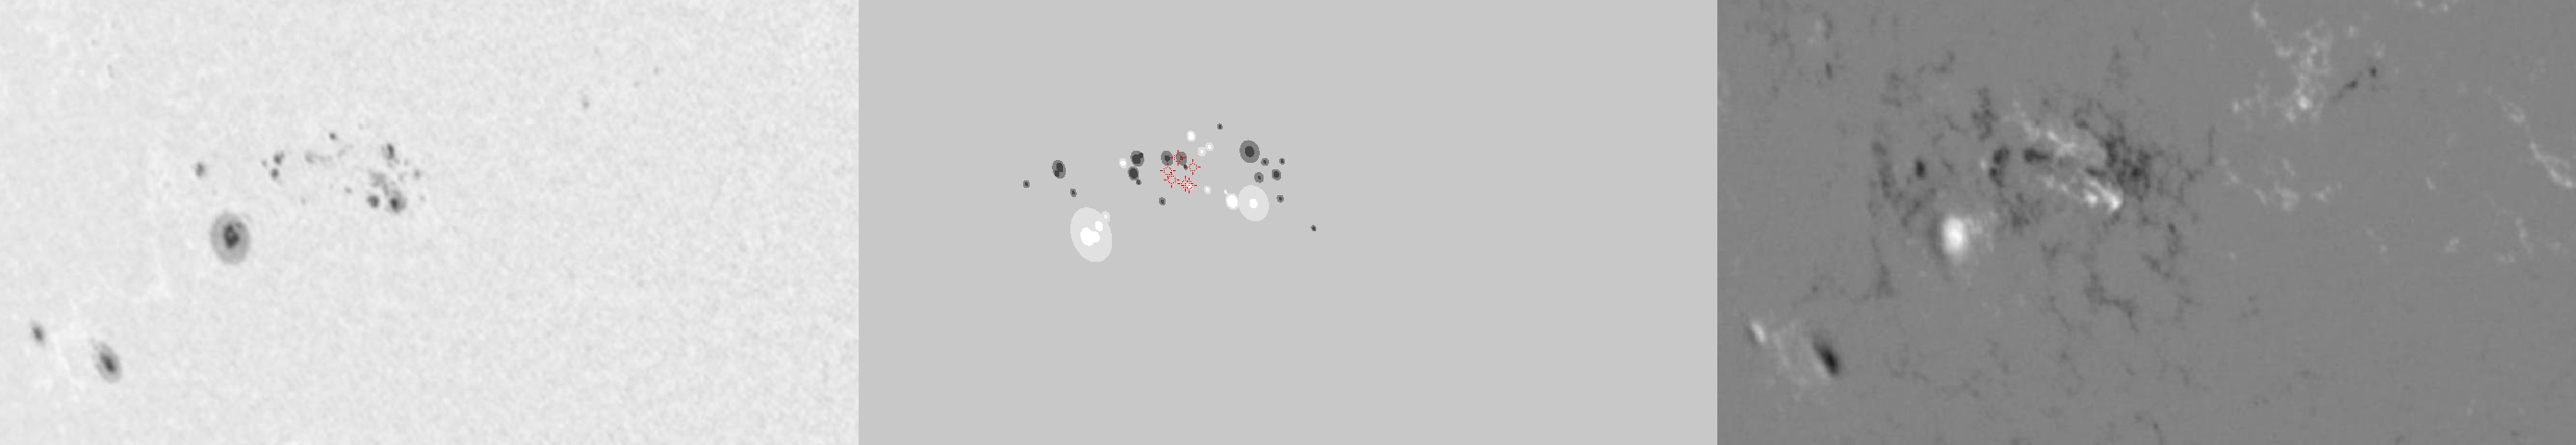
| Evolution of sunspot group NOAA 10180 and positions of flares in it animated by using the data of SOHO/MDI Debrecen Data (SDD) sunspot catalogue (lower panel, middle, ellipses with positions and areas corresponding to the relevant data of spots in SDD and with grey-scale colour coding of the magnetic polarities corresponding to that of the magnetograms), SOHO/MDI continuum images (lower panel, left) and magnetograms (lower panel, right), SOHO/EIT images (upper panel, middle), GOES and RHESSI flare data (red and blue symbols) observed within the interval around the time of SDD data. |
|
When you want to zoom in on one of the images, simply move the mouse pointer over that image. |
 |
| Year | Month | Day | Hour | Min | Sec | NOAA | Proj.U | Proj.WS | Corr.U | Corr.WS | B | L | LCM | Pos.angle | r | MU | MP |
|---|---|---|---|---|---|---|---|---|---|---|---|---|---|---|---|---|---|
| 2002 | 11 | 03 | 23 | 59 | 33 | 10180 | 115 | 690 | 78 | 465 | -10.06 | 306.51 | -40.15 | 109.77 | 0.6750 | 346.6 | 48.8 |
| Flare | Date | Start | Peak | End | Dur [s] | Peak [c/s] | Total Counts | Energy [keV] | X pos [asec] | Y pos [asec] | Radial [asec] | B [deg] | L [deg] | Flags |
|---|---|---|---|---|---|---|---|---|---|---|---|---|---|---|
| 2110330 | 3-Nov-2002 | 23:15:48 | 23:16:30 | 23:23:32 | 464 | 84 | 137016 | 6-12 | -591 | -191 | 621 | -8.17 | 307.57 | A0 P1 PE |
| 2110375 | 3-Nov-2002 | 23:23:32 | 23:24:58 | 23:28:04 | 272 | 46 | 53424 | 6-12 | -596 | -200 | 629 | -8.74 | 307.04 | A0 |
| 2110376 | 3-Nov-2002 | 23:28:04 | 23:30:18 | 23:33:40 | 336 | 34 | 56928 | 6-12 | -592 | -206 | 627 | -9.09 | 307.26 | A0 |
| 2110377 | 3-Nov-2002 | 23:33:40 | 23:35:46 | 23:38:36 | 296 | 32 | 44784 | 6-12 | -581 | -209 | 617 | -9.23 | 308.03 | A0 |
| 2110378 | 3-Nov-2002 | 23:38:36 | 23:40:14 | 23:49:48 | 672 | 28 | 81144 | 6-12 | -578 | -210 | 615 | -9.29 | 308.22 | A0 |
| 2110379 | 3-Nov-2002 | 23:55:56 | 23:56:18 | 23:59:16 | 200 | 18 | 18528 | 6-12 | -571 | -198 | 605 | -8.53 | 308.69 | A0 |
| Date | Start | Peak | End | Classification | B [deg] | LCM [deg] |
|---|---|---|---|---|---|---|
| No data |

