move the mouse pointer over that image.
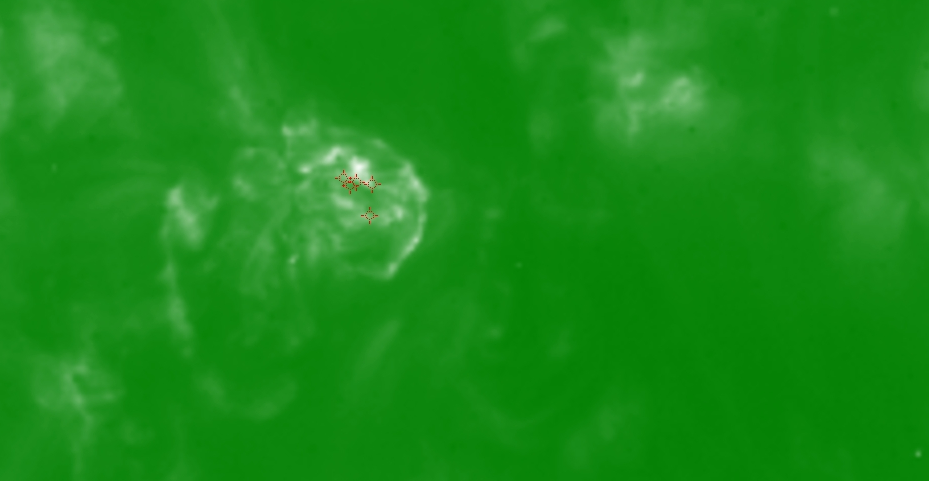
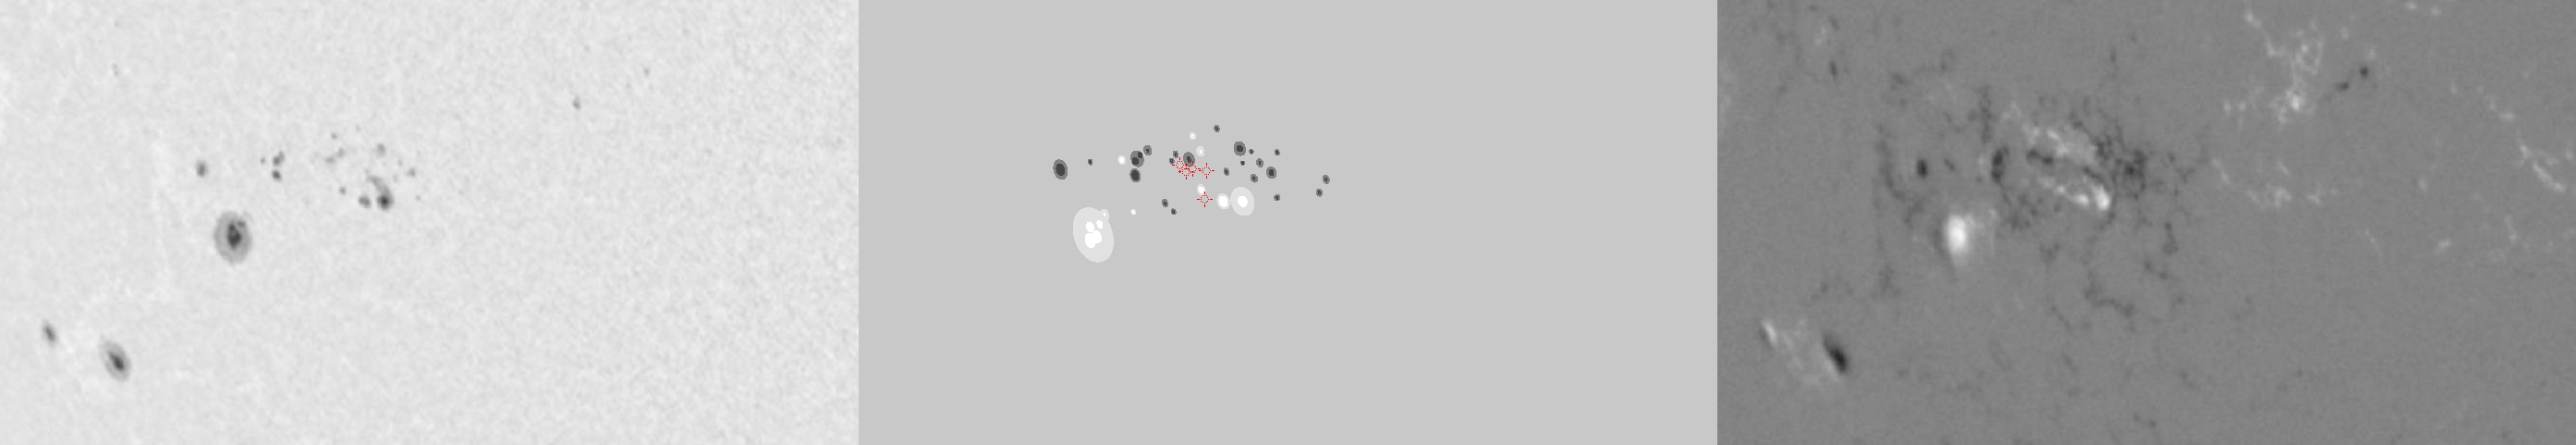
| Evolution of sunspot group NOAA 10180 and positions of flares in it animated by using the data of SOHO/MDI Debrecen Data (SDD) sunspot catalogue (lower panel, middle, ellipses with positions and areas corresponding to the relevant data of spots in SDD and with grey-scale colour coding of the magnetic polarities corresponding to that of the magnetograms), SOHO/MDI continuum images (lower panel, left) and magnetograms (lower panel, right), SOHO/EIT images (upper panel, middle), GOES and RHESSI flare data (red and blue symbols) observed within the interval around the time of SDD data. |
|
When you want to zoom in on one of the images, simply move the mouse pointer over that image. |
 |
| Year | Month | Day | Hour | Min | Sec | NOAA | Proj.U | Proj.WS | Corr.U | Corr.WS | B | L | LCM | Pos.angle | r | MU | MP |
|---|---|---|---|---|---|---|---|---|---|---|---|---|---|---|---|---|---|
| 2002 | 11 | 03 | 20 | 47 | 33 | 10180 | 103 | 601 | 73 | 420 | -10.19 | 305.92 | -42.49 | 108.95 | 0.7034 | 382.5 | 73.9 |
| Flare | Date | Start | Peak | End | Dur [s] | Peak [c/s] | Total Counts | Energy [keV] | X pos [asec] | Y pos [asec] | Radial [asec] | B [deg] | L [deg] | Flags |
|---|---|---|---|---|---|---|---|---|---|---|---|---|---|---|
| 2110355 | 3-Nov-2002 | 20:03:40 | 20:08:46 | 20:19:24 | 944 | 84 | 161352 | 6-12 | -594 | -218 | 632 | -9.82 | 308.85 | A0 DF P1 |
| 2110356 | 3-Nov-2002 | 20:24:32 | 20:29:02 | 20:38:36 | 844 | 208 | 305760 | 6-12 | -606 | -195 | 637 | -8.46 | 307.91 | A0 DF P1 |
| 2110373 | 3-Nov-2002 | 20:38:36 | 20:40:46 | 20:44:20 | 344 | 22 | 30048 | 6-12 | -585 | -199 | 619 | -8.63 | 309.41 | A0 DF P1 |
| 2110324 | 3-Nov-2002 | 20:49:48 | 20:51:58 | 20:56:32 | 404 | 28 | 37344 | 6-12 | -592 | -198 | 624 | -8.59 | 308.77 | A0 DF P1 PE |
| 2110358 | 3-Nov-2002 | 21:00:20 | 21:01:54 | 21:04:08 | 228 | 32 | 28752 | 6-12 | -594 | -200 | 627 | -8.72 | 308.51 | A0 DF P1 |
| Date | Start | Peak | End | Classification | B [deg] | LCM [deg] |
|---|---|---|---|---|---|---|
| No data |

