move the mouse pointer over that image.
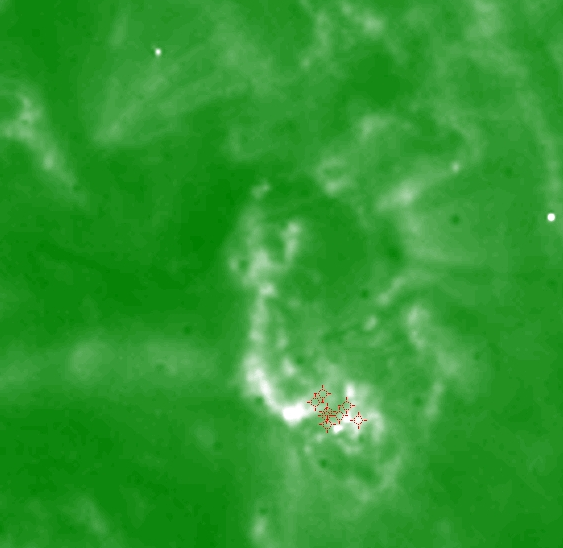
| Evolution of sunspot group NOAA 10139 and positions of flares in it animated by using the data of SOHO/MDI Debrecen Data (SDD) sunspot catalogue (lower panel, middle, ellipses with positions and areas corresponding to the relevant data of spots in SDD and with grey-scale colour coding of the magnetic polarities corresponding to that of the magnetograms), SOHO/MDI continuum images (lower panel, left) and magnetograms (lower panel, right), SOHO/EIT images (upper panel, middle), GOES and RHESSI flare data (red and blue symbols) observed within the interval around the time of SDD data. |
|
When you want to zoom in on one of the images, simply move the mouse pointer over that image. |
 |
| Year | Month | Day | Hour | Min | Sec | NOAA | Proj.U | Proj.WS | Corr.U | Corr.WS | B | L | LCM | Pos.angle | r | MU | MP |
|---|---|---|---|---|---|---|---|---|---|---|---|---|---|---|---|---|---|
| 2002 | 10 | 12 | 16 | 14 | 33 | 10139 | 139 | 1084 | 119 | 929 | 9.16 | 335.96 | 55.08 | 276.98 | 0.8175 | 379.3 | 178.4 |
| Flare | Date | Start | Peak | End | Dur [s] | Peak [c/s] | Total Counts | Energy [keV] | X pos [asec] | Y pos [asec] | Radial [asec] | B [deg] | L [deg] | Flags |
|---|---|---|---|---|---|---|---|---|---|---|---|---|---|---|
| 21012101 | 12-Oct-2002 | 13:54:24 | 13:55:14 | 13:58:04 | 220 | 64 | 43032 | 6-12 | 777 | 76 | 781 | 8.10 | 335.92 | A0 |
| 21012141 | 12-Oct-2002 | 13:58:04 | 13:59:26 | 14:02:24 | 260 | 32 | 37680 | 6-12 | 766 | 79 | 770 | 8.37 | 334.80 | A0 P1 PE |
| 2101259 | 12-Oct-2002 | 14:33:04 | 14:36:38 | 14:39:48 | 404 | 256 | 303360 | 6-12 | 777 | 86 | 782 | 8.69 | 335.66 | A0 GS P1 |
| 2101227 | 12-Oct-2002 | 15:24:24 | 15:25:58 | 15:30:48 | 384 | 168 | 150000 | 12-25 | 773 | 81 | 777 | 8.43 | 334.74 | A0 |
| 21012143 | 12-Oct-2002 | 15:30:48 | 15:32:06 | 15:34:44 | 236 | 30 | 35088 | 6-12 | 772 | 95 | 778 | 9.26 | 334.76 | A0 |
| 2101245 | 12-Oct-2002 | 15:36:08 | 15:37:22 | 15:42:00 | 352 | 232 | 219360 | 6-12 | 776 | 84 | 780 | 8.58 | 334.98 | A0 P1 PE |
| 21012103 | 12-Oct-2002 | 16:13:24 | 16:15:22 | 16:16:12 | 168 | 128 | 73104 | 6-12 | 775 | 91 | 780 | 9.00 | 334.62 | A0 |
| 21012104 | 12-Oct-2002 | 16:53:44 | 16:54:38 | 16:55:56 | 132 | 36 | 19632 | 6-12 | 789 | 78 | 793 | 8.10 | 335.55 | A0 |
| Date | Start | Peak | End | Classification | B [deg] | LCM [deg] |
|---|---|---|---|---|---|---|
| No data |

