
move the mouse pointer over that image.
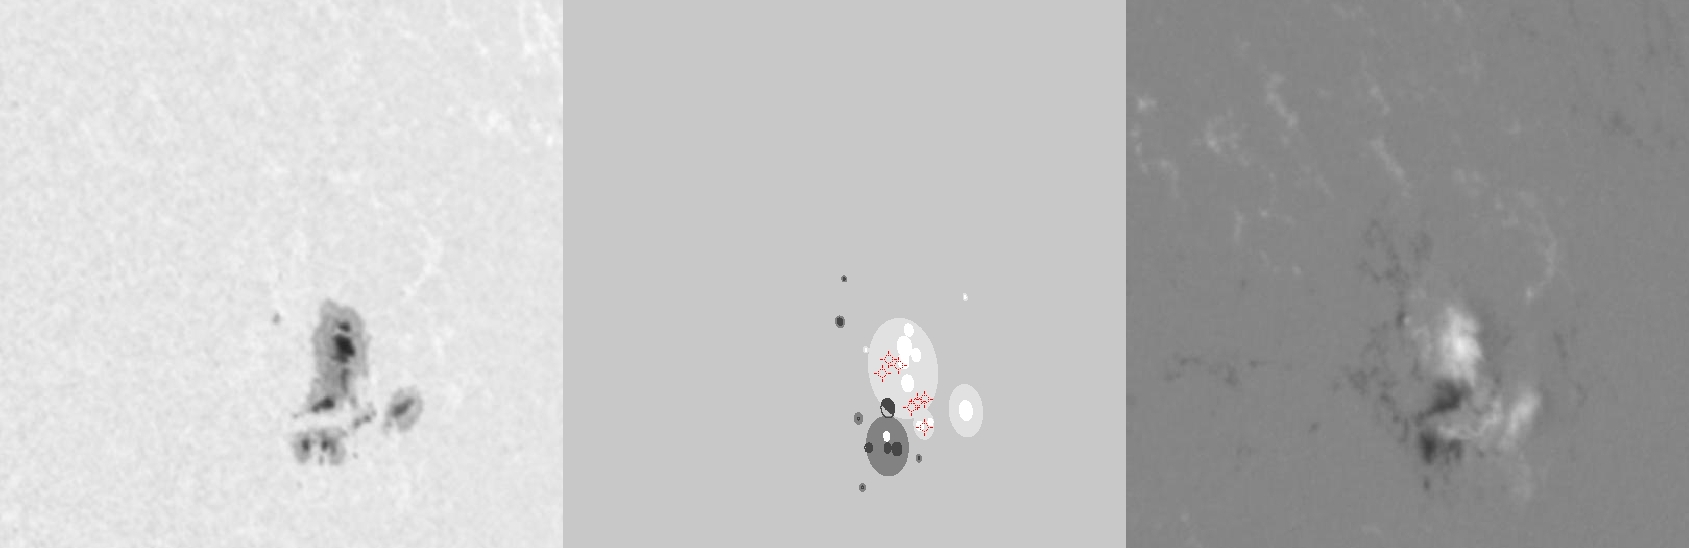
| Evolution of sunspot group NOAA 10139 and positions of flares in it animated by using the data of SOHO/MDI Debrecen Data (SDD) sunspot catalogue (lower panel, middle, ellipses with positions and areas corresponding to the relevant data of spots in SDD and with grey-scale colour coding of the magnetic polarities corresponding to that of the magnetograms), SOHO/MDI continuum images (lower panel, left) and magnetograms (lower panel, right), SOHO/EIT images (upper panel, middle), GOES and RHESSI flare data (red and blue symbols) observed within the interval around the time of SDD data. |
|
When you want to zoom in on one of the images, simply move the mouse pointer over that image. |
 |
| Year | Month | Day | Hour | Min | Sec | NOAA | Proj.U | Proj.WS | Corr.U | Corr.WS | B | L | LCM | Pos.angle | r | MU | MP |
|---|---|---|---|---|---|---|---|---|---|---|---|---|---|---|---|---|---|
| 2002 | 10 | 12 | 03 | 11 | 33 | 10139 | 199 | 1279 | 146 | 943 | 9.25 | 336.24 | 48.19 | 277.02 | 0.7435 | 435.9 | 164.7 |
| Flare | Date | Start | Peak | End | Dur [s] | Peak [c/s] | Total Counts | Energy [keV] | X pos [asec] | Y pos [asec] | Radial [asec] | B [deg] | L [deg] | Flags |
|---|---|---|---|---|---|---|---|---|---|---|---|---|---|---|
| 2101251 | 12-Oct-2002 | 02:28:20 | 02:30:26 | 02:32:48 | 268 | 80 | 49272 | 6-12 | 691 | 97 | 697 | 10.02 | 334.32 | A0 |
| 21012127 | 12-Oct-2002 | 02:32:48 | 02:40:50 | 02:44:16 | 688 | 432 | 299424 | 12-25 | 703 | 102 | 711 | 10.24 | 335.35 | A0 |
| 2101252 | 12-Oct-2002 | 02:44:16 | 02:45:58 | 02:48:04 | 228 | 84 | 50760 | 6-12 | 698 | 106 | 706 | 10.51 | 334.90 | A0 |
| 2101273 | 12-Oct-2002 | 02:48:04 | 02:49:26 | 02:52:44 | 280 | 72 | 64752 | 6-12 | 721 | 81 | 726 | 8.87 | 336.66 | A0 |
| 2101274 | 12-Oct-2002 | 02:52:44 | 02:54:58 | 02:58:20 | 336 | 52 | 61776 | 6-12 | 714 | 76 | 718 | 8.62 | 335.92 | A0 |
| 21012128 | 12-Oct-2002 | 03:05:08 | 03:07:02 | 03:11:00 | 352 | 48 | 53112 | 6-12 | 720 | 80 | 725 | 8.81 | 336.39 | A0 |
| 2101276 | 12-Oct-2002 | 03:11:00 | 03:21:54 | 03:26:04 | 904 | 304 | 398352 | 12-25 | 727 | 64 | 730 | 7.82 | 336.74 | A0 |
| Date | Start | Peak | End | Classification | B [deg] | LCM [deg] |
|---|---|---|---|---|---|---|
| No data |

