move the mouse pointer over that image.
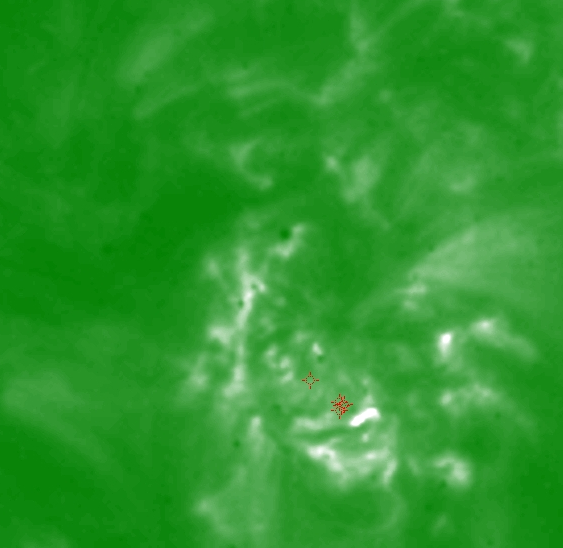
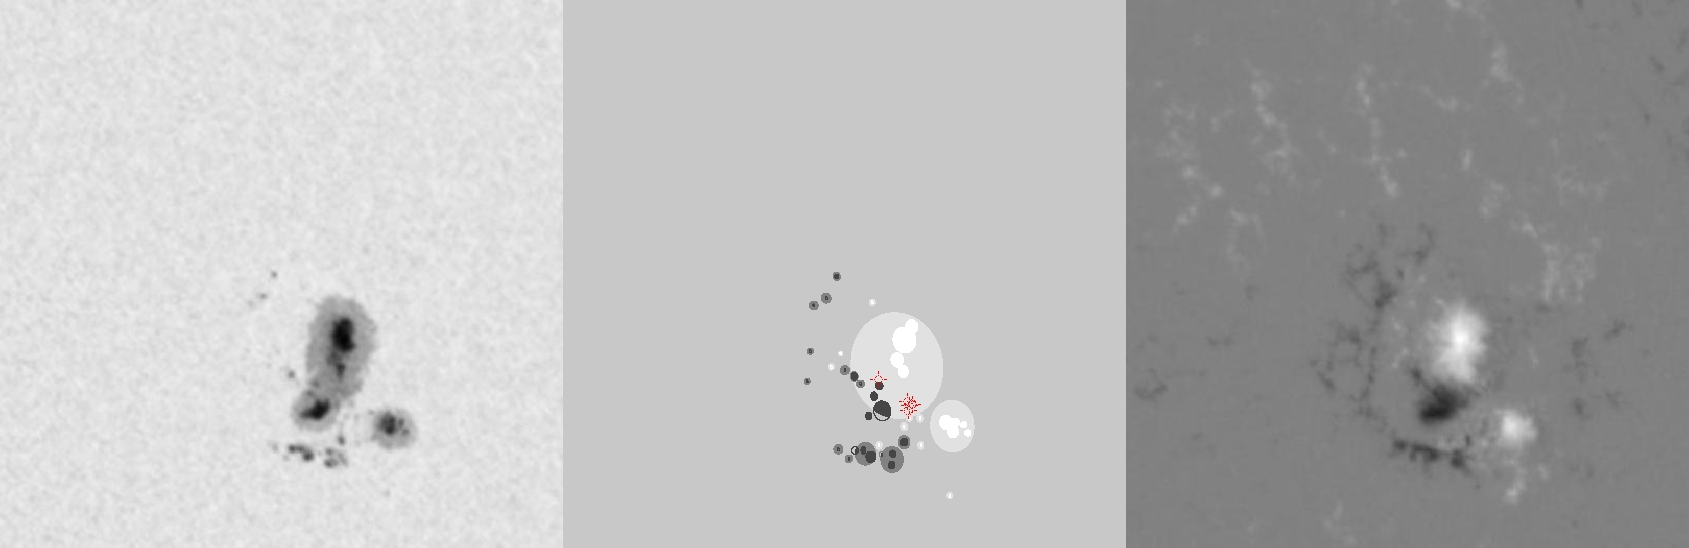
| Evolution of sunspot group NOAA 10139 and positions of flares in it animated by using the data of SOHO/MDI Debrecen Data (SDD) sunspot catalogue (lower panel, middle, ellipses with positions and areas corresponding to the relevant data of spots in SDD and with grey-scale colour coding of the magnetic polarities corresponding to that of the magnetograms), SOHO/MDI continuum images (lower panel, left) and magnetograms (lower panel, right), SOHO/EIT images (upper panel, middle), GOES and RHESSI flare data (red and blue symbols) observed within the interval around the time of SDD data. |
|
When you want to zoom in on one of the images, simply move the mouse pointer over that image. |
 |
| Year | Month | Day | Hour | Min | Sec | NOAA | Proj.U | Proj.WS | Corr.U | Corr.WS | B | L | LCM | Pos.angle | r | MU | MP |
|---|---|---|---|---|---|---|---|---|---|---|---|---|---|---|---|---|---|
| 2002 | 10 | 10 | 20 | 47 | 33 | 10139 | 258 | 1503 | 148 | 869 | 9.63 | 336.31 | 31.56 | 278.47 | 0.5243 | 530.9 | 202.3 |
| Flare | Date | Start | Peak | End | Dur [s] | Peak [c/s] | Total Counts | Energy [keV] | X pos [asec] | Y pos [asec] | Radial [asec] | B [deg] | L [deg] | Flags |
|---|---|---|---|---|---|---|---|---|---|---|---|---|---|---|
| 21010112 | 10-Oct-2002 | 20:03:28 | 20:05:50 | 20:09:16 | 348 | 72 | 69888 | 6-12 | 502 | 60 | 506 | 8.88 | 336.06 | A0 |
| 2101086 | 10-Oct-2002 | 20:09:16 | 20:12:46 | 20:17:44 | 508 | 60 | 99648 | 6-12 | 505 | 58 | 509 | 8.75 | 336.19 | A0 |
| 2101023 | 10-Oct-2002 | 20:19:24 | 20:21:46 | 20:27:40 | 496 | 112 | 128448 | 12-25 | 488 | 74 | 494 | 9.77 | 335.01 | A0 |
| 21010113 | 10-Oct-2002 | 20:32:28 | 20:33:02 | 20:34:48 | 140 | 32 | 21216 | 6-12 | 512 | 59 | 515 | 8.78 | 336.51 | A0 |
| 21010114 | 10-Oct-2002 | 20:34:48 | 20:39:38 | 20:40:40 | 352 | 100 | 120720 | 6-12 | 511 | 55 | 514 | 8.55 | 336.35 | A0 P1 PE |
| Date | Start | Peak | End | Classification | B [deg] | LCM [deg] |
|---|---|---|---|---|---|---|
| No data |

