move the mouse pointer over that image.
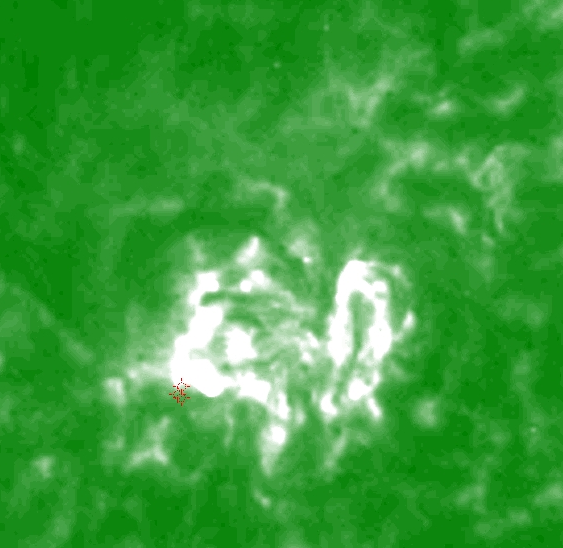
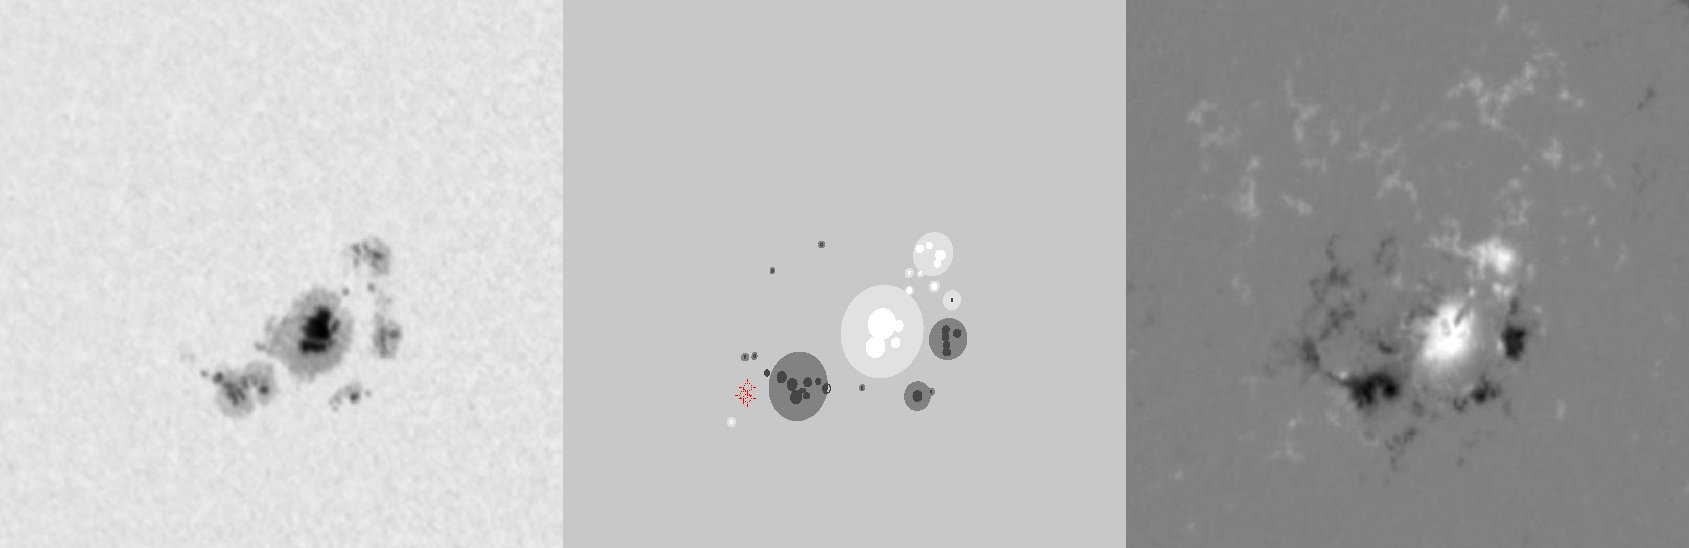
| Evolution of sunspot group NOAA 10139 and positions of flares in it animated by using the data of SOHO/MDI Debrecen Data (SDD) sunspot catalogue (lower panel, middle, ellipses with positions and areas corresponding to the relevant data of spots in SDD and with grey-scale colour coding of the magnetic polarities corresponding to that of the magnetograms), SOHO/MDI continuum images (lower panel, left) and magnetograms (lower panel, right), SOHO/EIT images (upper panel, middle), GOES and RHESSI flare data (red and blue symbols) observed within the interval around the time of SDD data. |
|
When you want to zoom in on one of the images, simply move the mouse pointer over that image. |
 |
| Year | Month | Day | Hour | Min | Sec | NOAA | Proj.U | Proj.WS | Corr.U | Corr.WS | B | L | LCM | Pos.angle | r | MU | MP |
|---|---|---|---|---|---|---|---|---|---|---|---|---|---|---|---|---|---|
| 2002 | 10 | 06 | 01 | 35 | 33 | 10139 | 282 | 1736 | 162 | 995 | 11.36 | 337.92 | -30.12 | 78.25 | 0.5048 | 531.5 | 62.0 |
| Flare | Date | Start | Peak | End | Dur [s] | Peak [c/s] | Total Counts | Energy [keV] | X pos [asec] | Y pos [asec] | Radial [asec] | B [deg] | L [deg] | Flags |
|---|---|---|---|---|---|---|---|---|---|---|---|---|---|---|
| 2100615 | 6-Oct-2002 | 01:19:00 | 01:21:38 | 01:22:20 | 200 | 240 | 101616 | 12-25 | -542 | 66 | 547 | 9.30 | -27.51 | A1 GE P1 PE |
| 2100606 | 6-Oct-2002 | 02:09:56 | 02:11:58 | 02:14:16 | 260 | 100 | 51264 | 12-25 | -532 | 60 | 535 | 8.99 | -27.21 | A1 |
| 2100607 | 6-Oct-2002 | 02:14:16 | 02:15:26 | 02:17:04 | 168 | 24 | 16584 | 12-25 | -529 | 58 | 532 | 8.89 | -27.01 | A1 |
| Date | Start | Peak | End | Classification | B [deg] | LCM [deg] |
|---|---|---|---|---|---|---|
| No data |

