move the mouse pointer over that image.
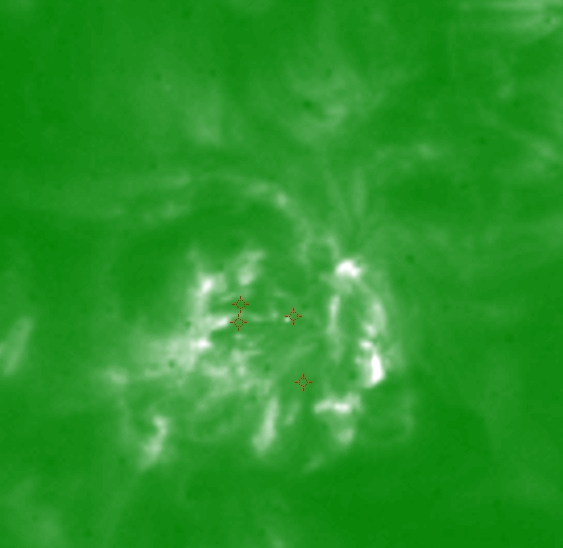
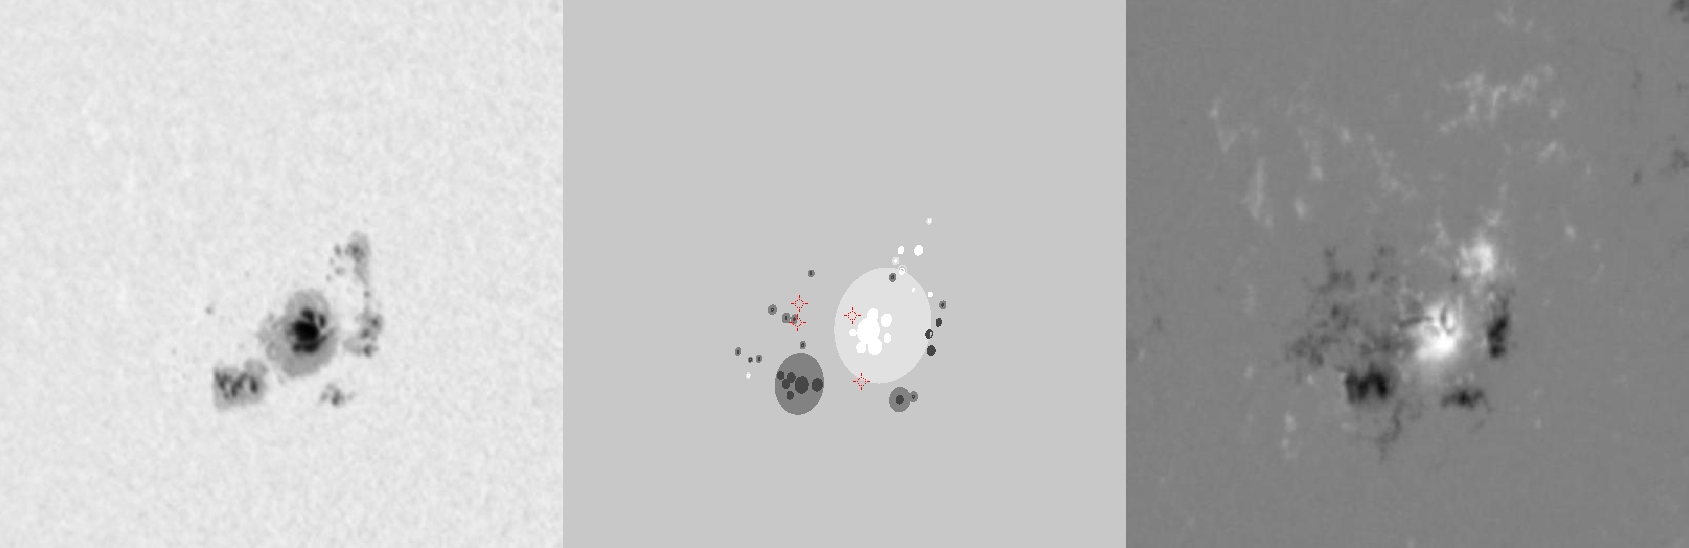
| Evolution of sunspot group NOAA 10139 and positions of flares in it animated by using the data of SOHO/MDI Debrecen Data (SDD) sunspot catalogue (lower panel, middle, ellipses with positions and areas corresponding to the relevant data of spots in SDD and with grey-scale colour coding of the magnetic polarities corresponding to that of the magnetograms), SOHO/MDI continuum images (lower panel, left) and magnetograms (lower panel, right), SOHO/EIT images (upper panel, middle), GOES and RHESSI flare data (red and blue symbols) observed within the interval around the time of SDD data. |
|
When you want to zoom in on one of the images, simply move the mouse pointer over that image. |
 |
| Year | Month | Day | Hour | Min | Sec | NOAA | Proj.U | Proj.WS | Corr.U | Corr.WS | B | L | LCM | Pos.angle | r | MU | MP |
|---|---|---|---|---|---|---|---|---|---|---|---|---|---|---|---|---|---|
| 2002 | 10 | 05 | 14 | 23 | 33 | 10139 | 228 | 1611 | 141 | 991 | 11.42 | 337.87 | -36.32 | 79.39 | 0.5929 | 377.6 | 59.1 |
| Flare | Date | Start | Peak | End | Dur [s] | Peak [c/s] | Total Counts | Energy [keV] | X pos [asec] | Y pos [asec] | Radial [asec] | B [deg] | L [deg] | Flags |
|---|---|---|---|---|---|---|---|---|---|---|---|---|---|---|
| 2100580 | 5-Oct-2002 | 14:00:48 | 14:00:54 | 14:02:48 | 120 | 5 | 2777 | 6-12 | -593 | 113 | 603 | 11.86 | -25.51 | A0 DF GS P1 |
| 2100588 | 5-Oct-2002 | 14:02:48 | 14:07:26 | 14:09:00 | 372 | 7 | 10183 | 6-12 | -557 | 117 | 569 | 12.28 | -22.86 | A0 DF P1 |
| 2100558 | 5-Oct-2002 | 14:44:52 | 14:48:02 | 15:01:44 | 1012 | 95 | 205636 | 6-12 | -541 | 75 | 546 | 9.86 | -21.70 | A0 DF P1 PE |
| 2100559 | 5-Oct-2002 | 15:09:16 | 15:16:18 | 15:16:56 | 460 | 120 | 108816 | 6-12 | -574 | 123 | 587 | 12.55 | -24.84 | A0 P1 PE Q2 |
| Date | Start | Peak | End | Classification | B [deg] | LCM [deg] |
|---|---|---|---|---|---|---|
| No data |

