move the mouse pointer over that image.
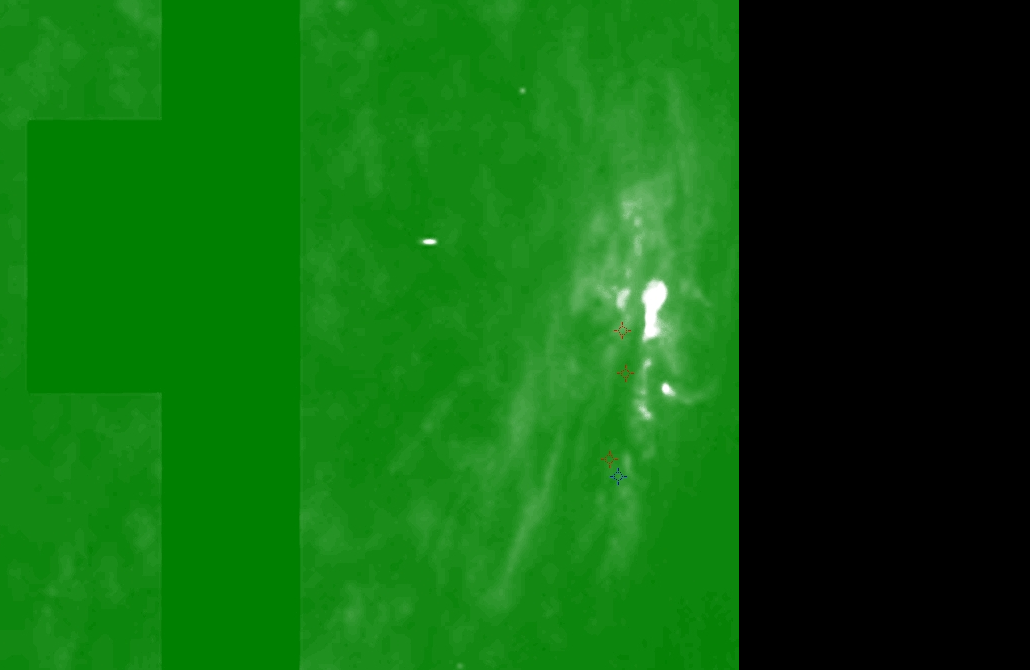
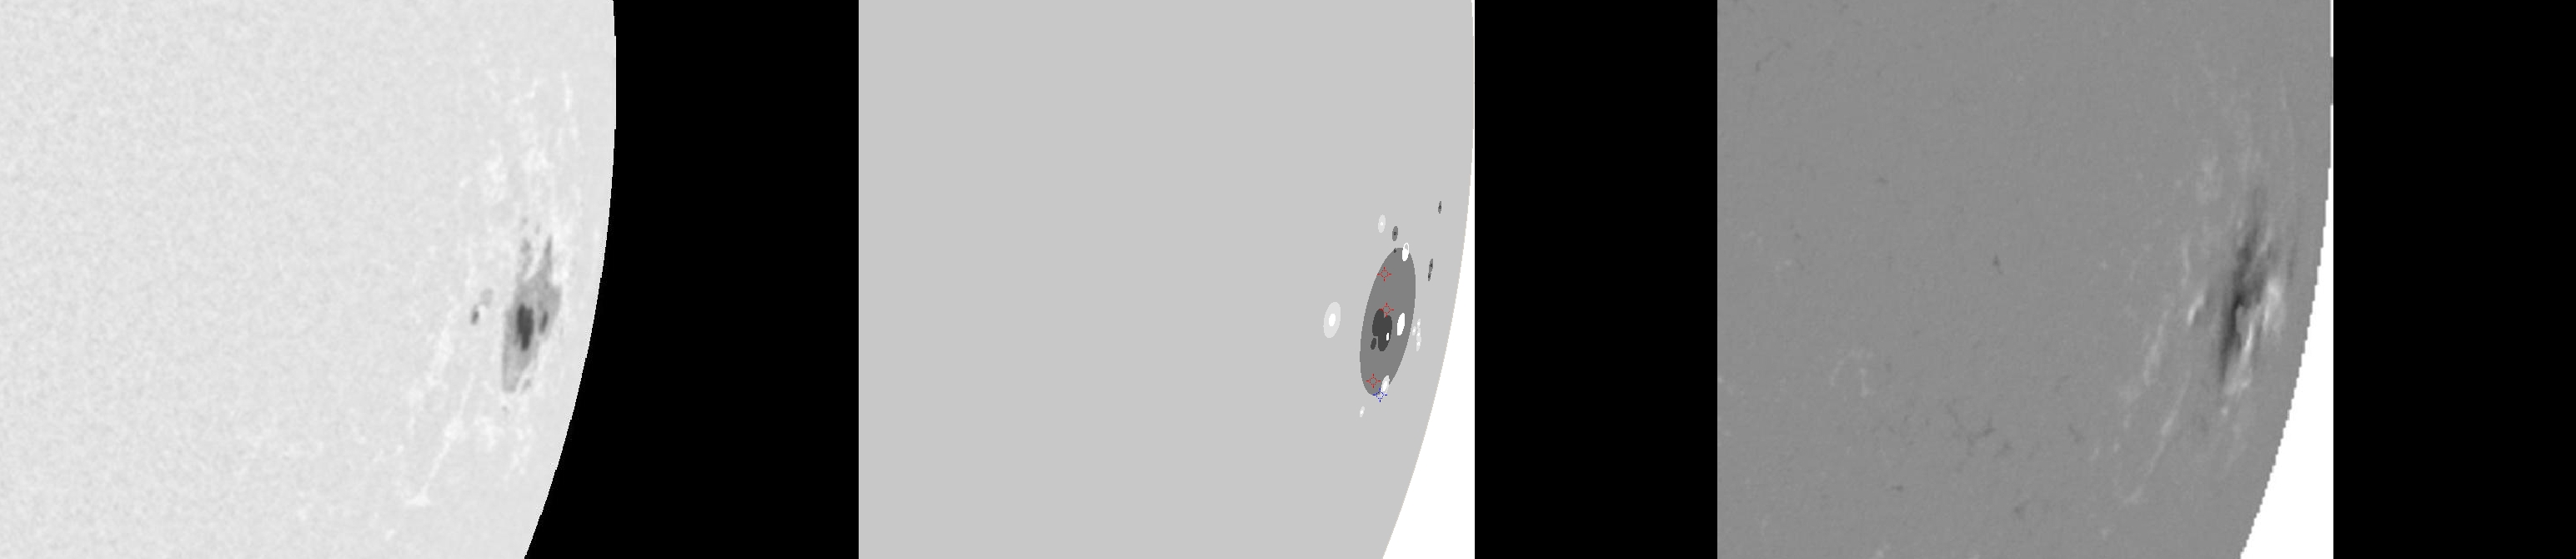
| Evolution of sunspot group NOAA 10069 and positions of flares in it animated by using the data of SOHO/MDI Debrecen Data (SDD) sunspot catalogue (lower panel, middle, ellipses with positions and areas corresponding to the relevant data of spots in SDD and with grey-scale colour coding of the magnetic polarities corresponding to that of the magnetograms), SOHO/MDI continuum images (lower panel, left) and magnetograms (lower panel, right), SOHO/EIT images (upper panel, middle), GOES and RHESSI flare data (red and blue symbols) observed within the interval around the time of SDD data. |
|
When you want to zoom in on one of the images, simply move the mouse pointer over that image. |
 |
| Year | Month | Day | Hour | Min | Sec | NOAA | Proj.U | Proj.WS | Corr.U | Corr.WS | B | L | LCM | Pos.angle | r | MU | MP |
|---|---|---|---|---|---|---|---|---|---|---|---|---|---|---|---|---|---|
| 2002 | 08 | 22 | 20 | 47 | 32 | 10069 | 160 | 1247 | 250 | 1966 | -8.26 | 301.67 | 70.23 | 258.86 | 0.9498 | -199.0 | -189.6 |
| Flare | Date | Start | Peak | End | Dur [s] | Peak [c/s] | Total Counts | Energy [keV] | X pos [asec] | Y pos [asec] | Radial [asec] | B [deg] | L [deg] | Flags |
|---|---|---|---|---|---|---|---|---|---|---|---|---|---|---|
| 2082227 | 22-Aug-2002 | 20:34:08 | 20:35:58 | 20:45:36 | 688 | 208 | 159168 | 25-50 | 881 | -225 | 910 | -11.17 | 300.10 | A1 |
| 20822115 | 22-Aug-2002 | 20:47:08 | 20:47:30 | 20:48:00 | 52 | 20 | 3912 | 12-25 | 891 | -144 | 903 | -6.18 | 299.68 | A1 |
| 2082230 | 22-Aug-2002 | 21:15:04 | 21:15:34 | 21:17:56 | 172 | 26 | 17160 | 12-25 | 895 | -170 | 911 | -7.91 | 300.70 | A1 |
| Date | Start | Peak | End | Classification | B [deg] | LCM [deg] |
|---|---|---|---|---|---|---|
| 22-Aug-2002 | 20:33 | 20:37 | 20:41 | C4.3 | -12 | 70 |

