move the mouse pointer over that image.
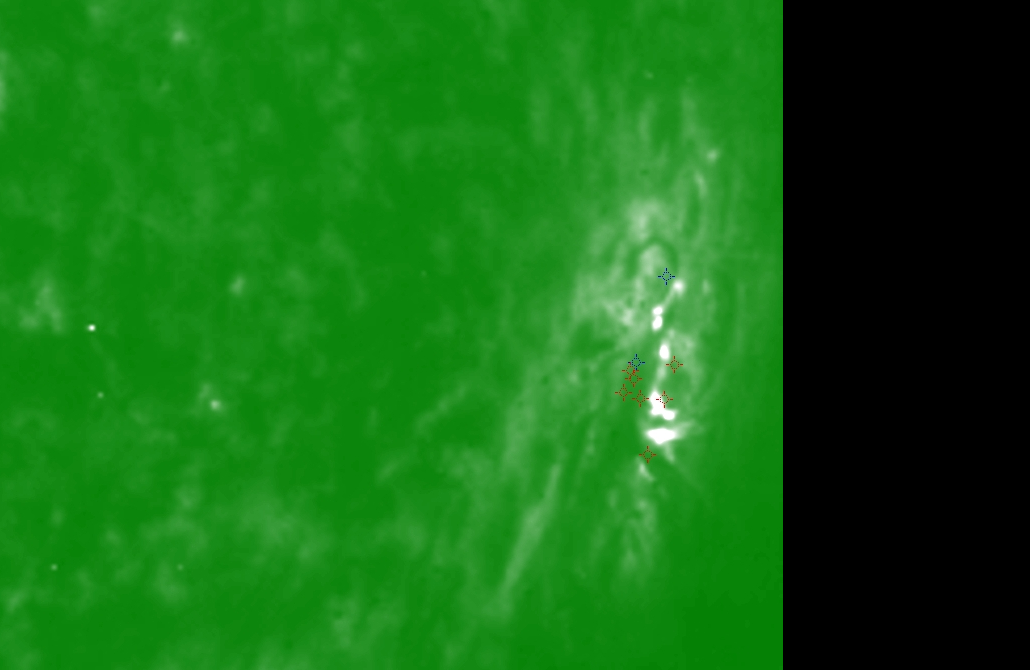
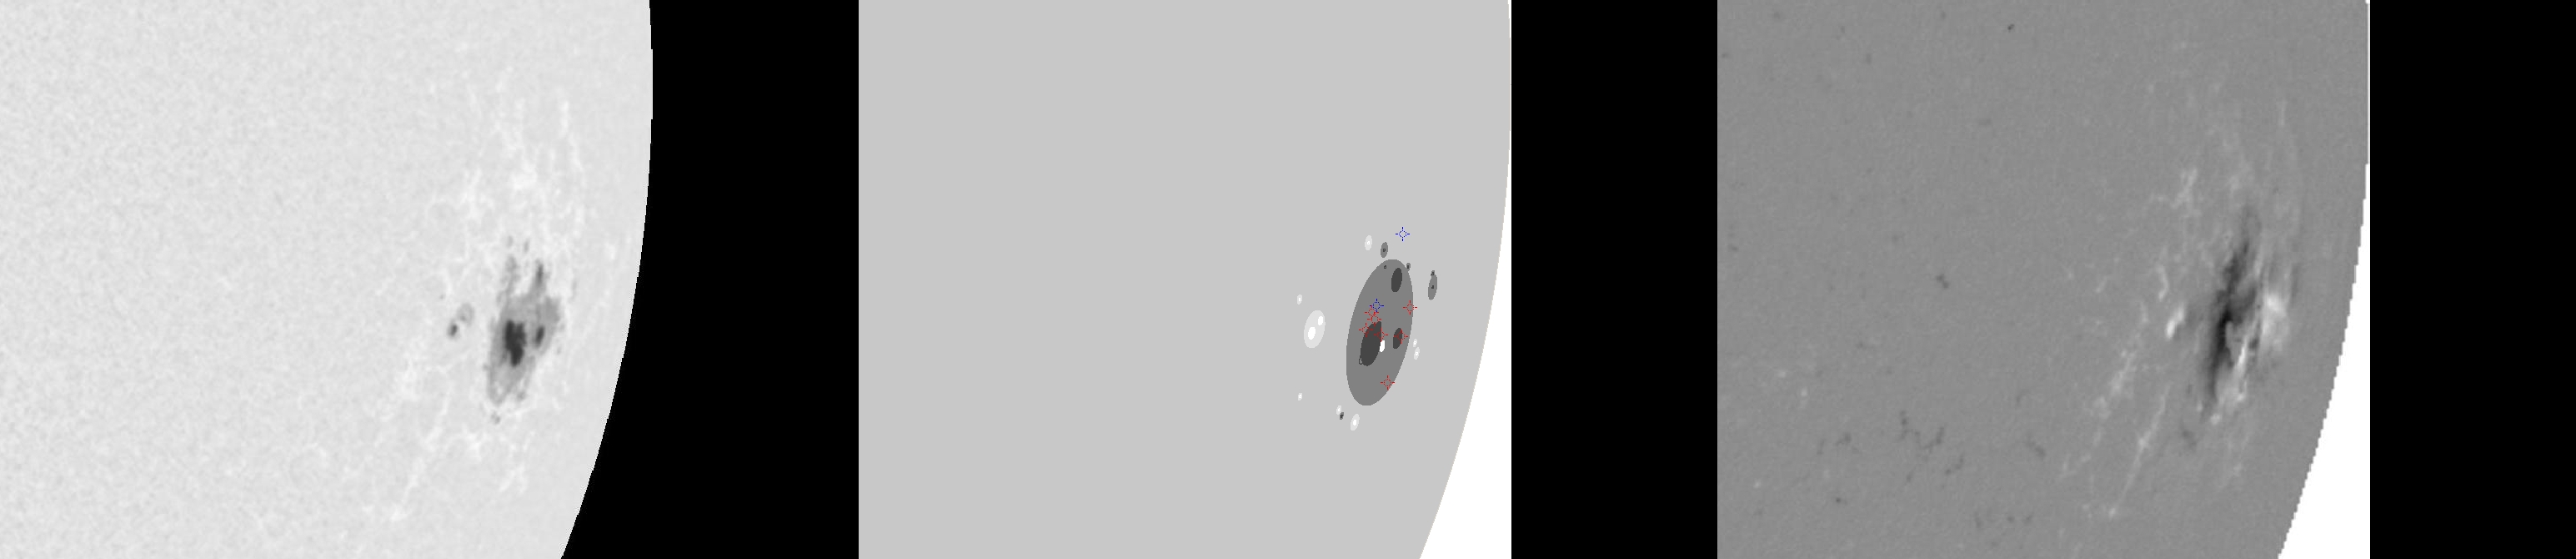
| Evolution of sunspot group NOAA 10069 and positions of flares in it animated by using the data of SOHO/MDI Debrecen Data (SDD) sunspot catalogue (lower panel, middle, ellipses with positions and areas corresponding to the relevant data of spots in SDD and with grey-scale colour coding of the magnetic polarities corresponding to that of the magnetograms), SOHO/MDI continuum images (lower panel, left) and magnetograms (lower panel, right), SOHO/EIT images (upper panel, middle), GOES and RHESSI flare data (red and blue symbols) observed within the interval around the time of SDD data. |
|
When you want to zoom in on one of the images, simply move the mouse pointer over that image. |
 |
| Year | Month | Day | Hour | Min | Sec | NOAA | Proj.U | Proj.WS | Corr.U | Corr.WS | B | L | LCM | Pos.angle | r | MU | MP |
|---|---|---|---|---|---|---|---|---|---|---|---|---|---|---|---|---|---|
| 2002 | 08 | 22 | 10 | 55 | 32 | 10069 | 219 | 1581 | 268 | 1942 | -8.05 | 301.54 | 64.66 | 257.98 | 0.9160 | -276.4 | -197.6 |
| Flare | Date | Start | Peak | End | Dur [s] | Peak [c/s] | Total Counts | Energy [keV] | X pos [asec] | Y pos [asec] | Radial [asec] | B [deg] | L [deg] | Flags |
|---|---|---|---|---|---|---|---|---|---|---|---|---|---|---|
| 20822101 | 22-Aug-2002 | 08:00:40 | 08:04:46 | 08:10:00 | 560 | 176 | 148248 | 25-50 | 845 | -230 | 876 | -10.85 | 301.33 | A1 |
| 2082218 | 22-Aug-2002 | 12:32:32 | 12:33:46 | 12:38:32 | 360 | 18 | 26352 | 12-25 | 868 | -168 | 885 | -7.27 | 300.91 | A1 |
| 20822110 | 22-Aug-2002 | 12:38:32 | 12:41:14 | 12:43:40 | 308 | 16 | 21456 | 6-12 | 888 | -186 | 907 | -8.79 | 304.54 | A1 |
| 20822111 | 22-Aug-2002 | 12:43:40 | 12:45:06 | 12:48:44 | 304 | 14 | 17376 | 6-12 | 875 | -185 | 895 | -8.47 | 302.25 | A1 |
| 2082220 | 22-Aug-2002 | 12:52:00 | 12:53:38 | 12:55:20 | 200 | 52 | 20880 | 12-25 | 866 | -181 | 885 | -8.05 | 300.67 | A1 P1 PE |
| 20822112 | 22-Aug-2002 | 13:25:28 | 13:25:34 | 13:27:20 | 112 | 28 | 13440 | 6-12 | 899 | -163 | 913 | -7.55 | 305.60 | A1 GS P1 |
| 2082221 | 22-Aug-2002 | 14:09:08 | 14:09:42 | 14:11:08 | 120 | 30 | 9816 | 6-12 | 881 | -170 | 897 | -7.63 | 302.13 | A1 |
| Date | Start | Peak | End | Classification | B [deg] | LCM [deg] |
|---|---|---|---|---|---|---|
| 22-Aug-2002 | 08:02 | 08:05 | 08:07 | C5.7 | -07 | 62 |
| 22-Aug-2002 | 13:17 | 13:20 | 13:28 | C2.9 | -04 | 67 |

