move the mouse pointer over that image.
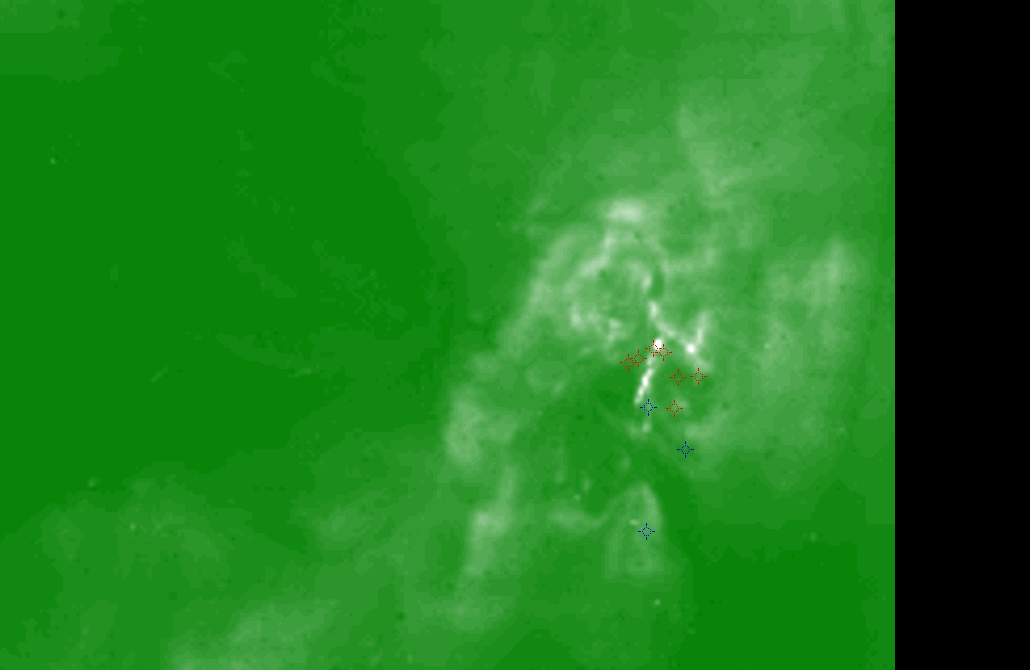
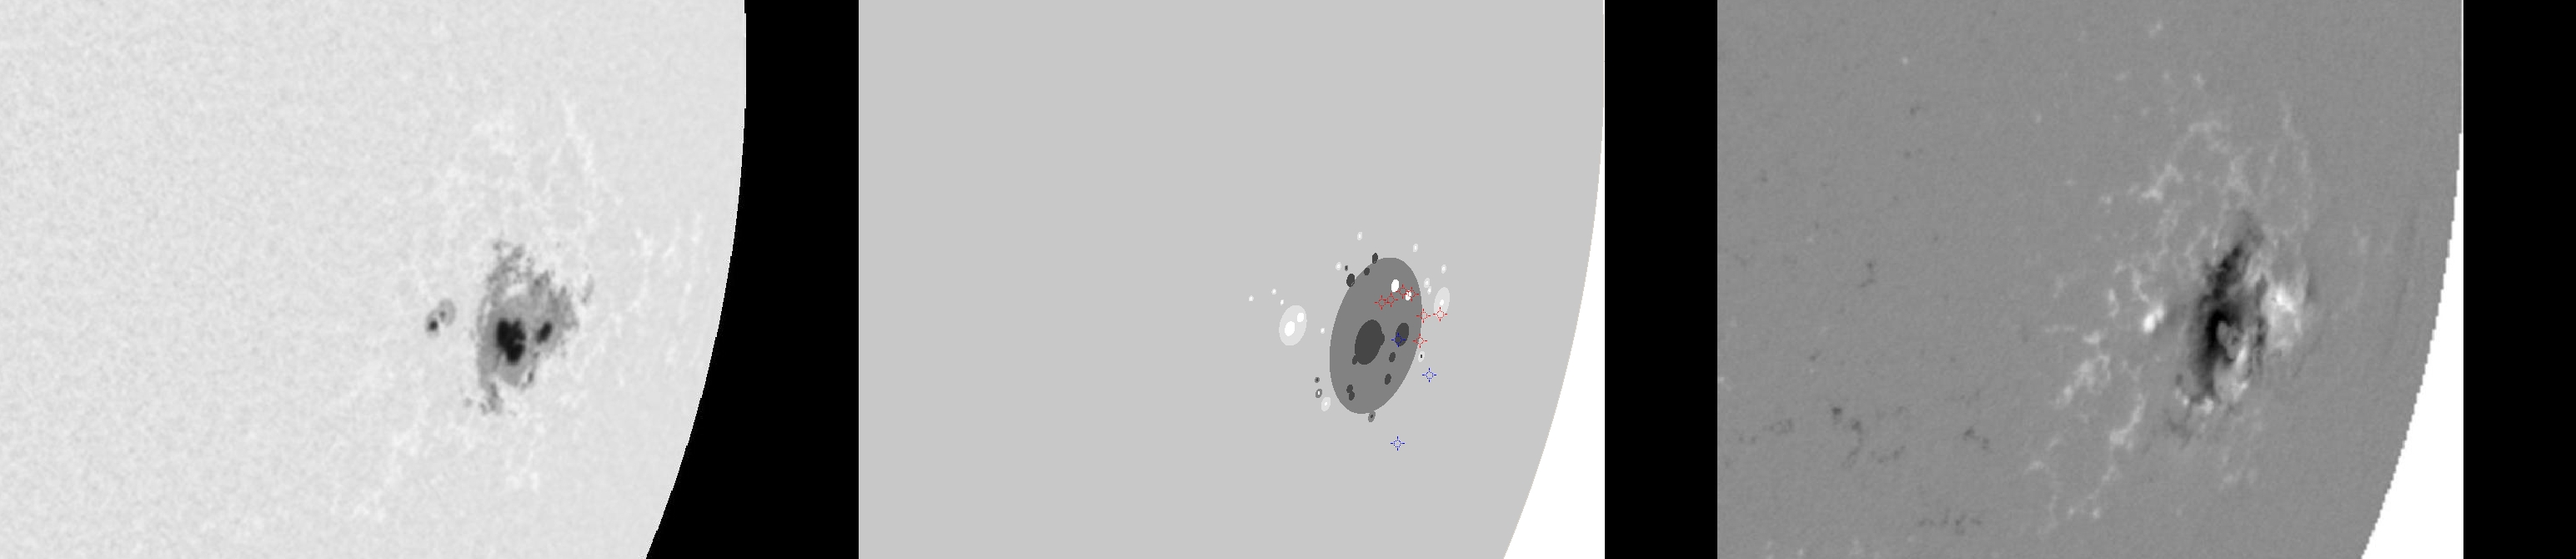
| Evolution of sunspot group NOAA 10069 and positions of flares in it animated by using the data of SOHO/MDI Debrecen Data (SDD) sunspot catalogue (lower panel, middle, ellipses with positions and areas corresponding to the relevant data of spots in SDD and with grey-scale colour coding of the magnetic polarities corresponding to that of the magnetograms), SOHO/MDI continuum images (lower panel, left) and magnetograms (lower panel, right), SOHO/EIT images (upper panel, middle), GOES and RHESSI flare data (red and blue symbols) observed within the interval around the time of SDD data. |
|
When you want to zoom in on one of the images, simply move the mouse pointer over that image. |
 |
| Year | Month | Day | Hour | Min | Sec | NOAA | Proj.U | Proj.WS | Corr.U | Corr.WS | B | L | LCM | Pos.angle | r | MU | MP |
|---|---|---|---|---|---|---|---|---|---|---|---|---|---|---|---|---|---|
| 2002 | 08 | 21 | 19 | 00 | 32 | 10069 | 329 | 2381 | 301 | 2208 | -8.34 | 301.43 | 55.79 | 255.53 | 0.8466 | -467.3 | -260.9 |
| Flare | Date | Start | Peak | End | Dur [s] | Peak [c/s] | Total Counts | Energy [keV] | X pos [asec] | Y pos [asec] | Radial [asec] | B [deg] | L [deg] | Flags |
|---|---|---|---|---|---|---|---|---|---|---|---|---|---|---|
| 2082128 | 21-Aug-2002 | 16:04:20 | 16:05:10 | 16:06:28 | 128 | 30 | 13512 | 12-25 | 781 | -178 | 801 | -6.75 | 301.45 | A1 |
| 2082166 | 21-Aug-2002 | 16:09:12 | 16:10:58 | 16:11:08 | 116 | 88 | 25176 | 12-25 | 789 | -180 | 809 | -6.96 | 302.28 | A1 GE P1 PE |
| 2082150 | 21-Aug-2002 | 17:16:04 | 17:16:34 | 17:19:40 | 216 | 24 | 16978 | 12-25 | 784 | -182 | 805 | -7.03 | 301.16 | A1 a3 |
| 20821141 | 21-Aug-2002 | 17:19:40 | 17:25:26 | 17:33:04 | 804 | 176 | 241560 | 12-25 | 808 | -213 | 836 | -9.25 | 304.23 | A1 |
| 20821142 | 21-Aug-2002 | 17:33:04 | 17:34:26 | 17:36:20 | 196 | 14 | 11928 | 6-12 | 825 | -193 | 847 | -8.21 | 305.89 | A1 |
| 2082130 | 21-Aug-2002 | 18:52:48 | 18:58:38 | 19:03:08 | 620 | 36 | 66432 | 6-12 | 825 | -191 | 847 | -8.08 | 305.09 | A1 |
| 20821143 | 21-Aug-2002 | 19:03:08 | 19:05:50 | 19:14:56 | 708 | 1520 | 1449960 | 25-50 | 796 | -181 | 817 | -7.10 | 301.46 | A1 |
| Date | Start | Peak | End | Classification | B [deg] | LCM [deg] |
|---|---|---|---|---|---|---|
| 21-Aug-2002 | 16:09 | 16:12 | 16:14 | C3.0 | -09 | 56 |
| 21-Aug-2002 | 16:58 | 17:02 | 17:11 | C3.6 | -14 | 58 |
| 21-Aug-2002 | 17:20 | 17:25 | 17:27 | C4.8 | -11 | 60 |

