move the mouse pointer over that image.
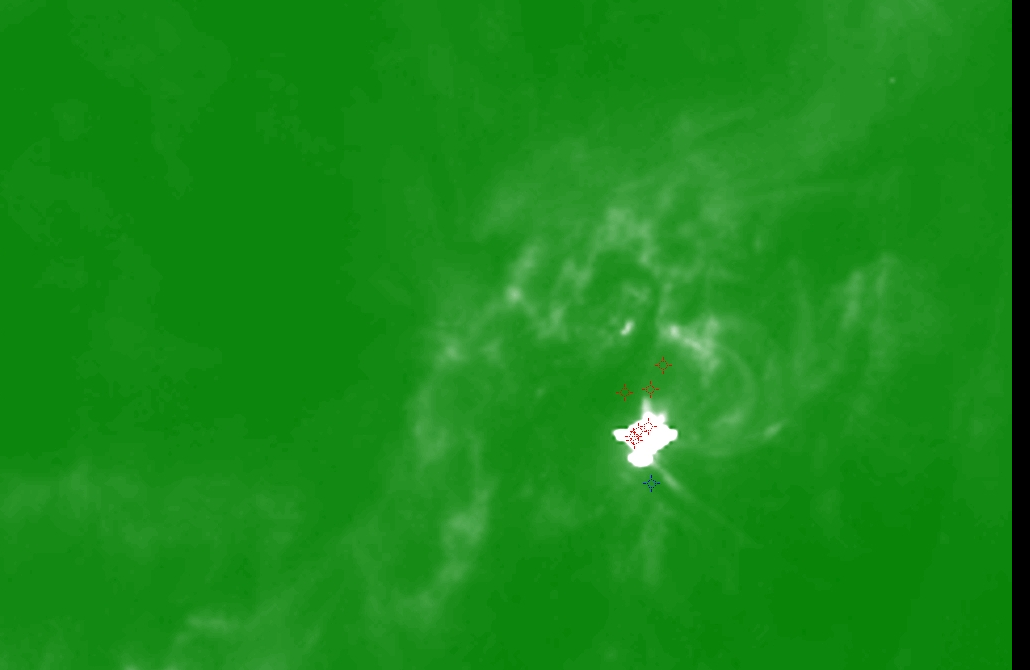
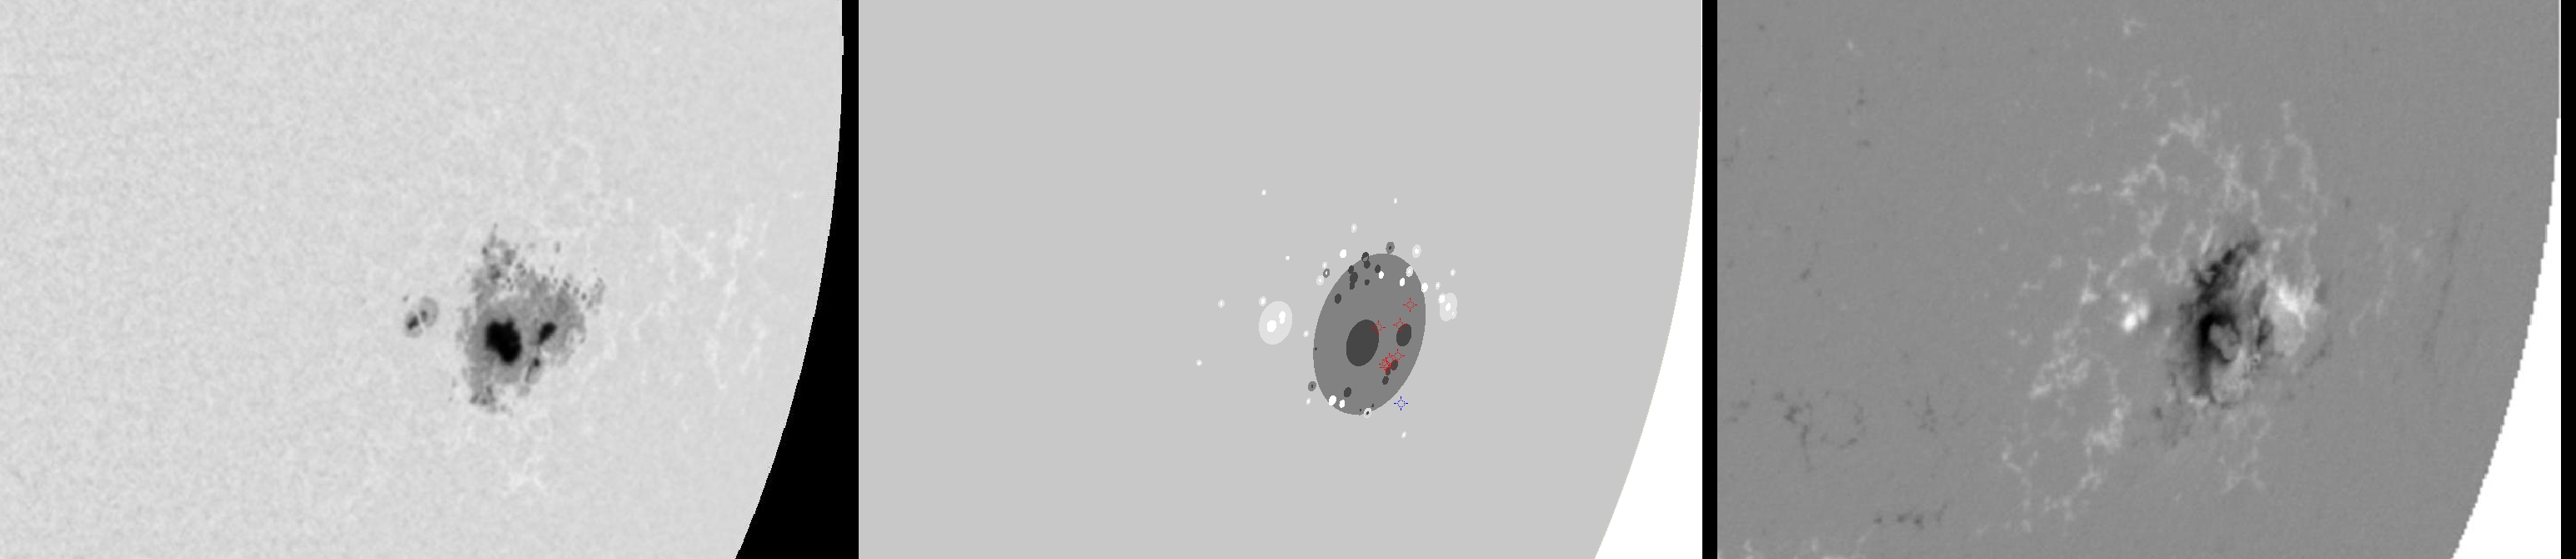
| Evolution of sunspot group NOAA 10069 and positions of flares in it animated by using the data of SOHO/MDI Debrecen Data (SDD) sunspot catalogue (lower panel, middle, ellipses with positions and areas corresponding to the relevant data of spots in SDD and with grey-scale colour coding of the magnetic polarities corresponding to that of the magnetograms), SOHO/MDI continuum images (lower panel, left) and magnetograms (lower panel, right), SOHO/EIT images (upper panel, middle), GOES and RHESSI flare data (red and blue symbols) observed within the interval around the time of SDD data. |
|
When you want to zoom in on one of the images, simply move the mouse pointer over that image. |
 |
| Year | Month | Day | Hour | Min | Sec | NOAA | Proj.U | Proj.WS | Corr.U | Corr.WS | B | L | LCM | Pos.angle | r | MU | MP |
|---|---|---|---|---|---|---|---|---|---|---|---|---|---|---|---|---|---|
| 2002 | 08 | 21 | 05 | 27 | 32 | 10069 | 418 | 3082 | 323 | 2388 | -8.18 | 301.15 | 48.05 | 253.29 | 0.7704 | -572.8 | -247.9 |
| Flare | Date | Start | Peak | End | Dur [s] | Peak [c/s] | Total Counts | Energy [keV] | X pos [asec] | Y pos [asec] | Radial [asec] | B [deg] | L [deg] | Flags |
|---|---|---|---|---|---|---|---|---|---|---|---|---|---|---|
| 2082109 | 21-Aug-2002 | 03:39:36 | 03:41:10 | 03:42:56 | 200 | 34 | 17184 | 12-25 | 724 | -197 | 751 | -7.39 | 302.78 | A1 DF P1 |
| 2082111 | 21-Aug-2002 | 04:31:36 | 04:34:30 | 04:37:20 | 344 | 22 | 24144 | 12-25 | 716 | -240 | 755 | -10.01 | 302.02 | A1 DF P1 |
| 20821134 | 21-Aug-2002 | 04:57:08 | 04:57:42 | 05:00:56 | 228 | 8 | 8784 | 6-12 | 731 | -210 | 761 | -8.26 | 302.87 | A1 DF P1 |
| 2082176 | 21-Aug-2002 | 05:04:24 | 05:06:30 | 05:09:00 | 276 | 44 | 41616 | 12-25 | 725 | -236 | 763 | -9.84 | 302.53 | A1 DF P1 PE |
| 20821135 | 21-Aug-2002 | 05:09:00 | 05:10:46 | 05:16:44 | 464 | 34 | 40584 | 6-12 | 732 | -233 | 769 | -9.71 | 303.13 | A1 DF P1 PE |
| 20821114 | 21-Aug-2002 | 05:17:32 | 05:18:02 | 05:20:24 | 172 | 22 | 11352 | 12-25 | 719 | -211 | 750 | -8.22 | 301.56 | A1 DF P1 |
| 2082159 | 21-Aug-2002 | 05:23:04 | 05:27:14 | 05:29:12 | 368 | 42 | 47544 | 12-25 | 727 | -241 | 766 | -10.17 | 302.60 | A1 DF P1 |
| Date | Start | Peak | End | Classification | B [deg] | LCM [deg] |
|---|---|---|---|---|---|---|
| 21-Aug-2002 | 05:28 | 05:34 | 05:36 | X1.0 | -12 | 51 |

