move the mouse pointer over that image.
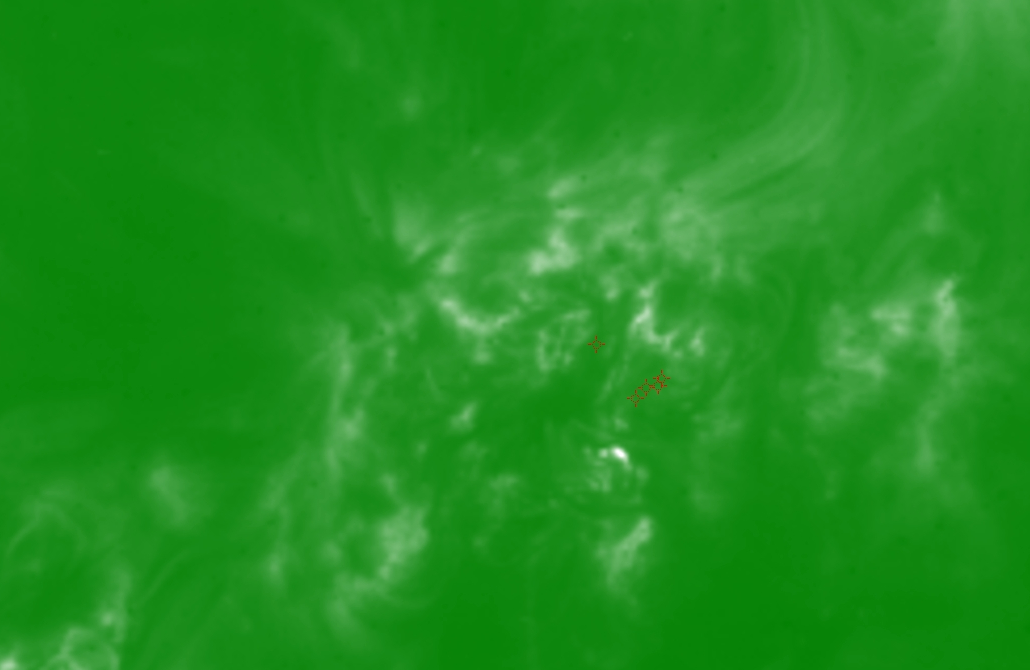
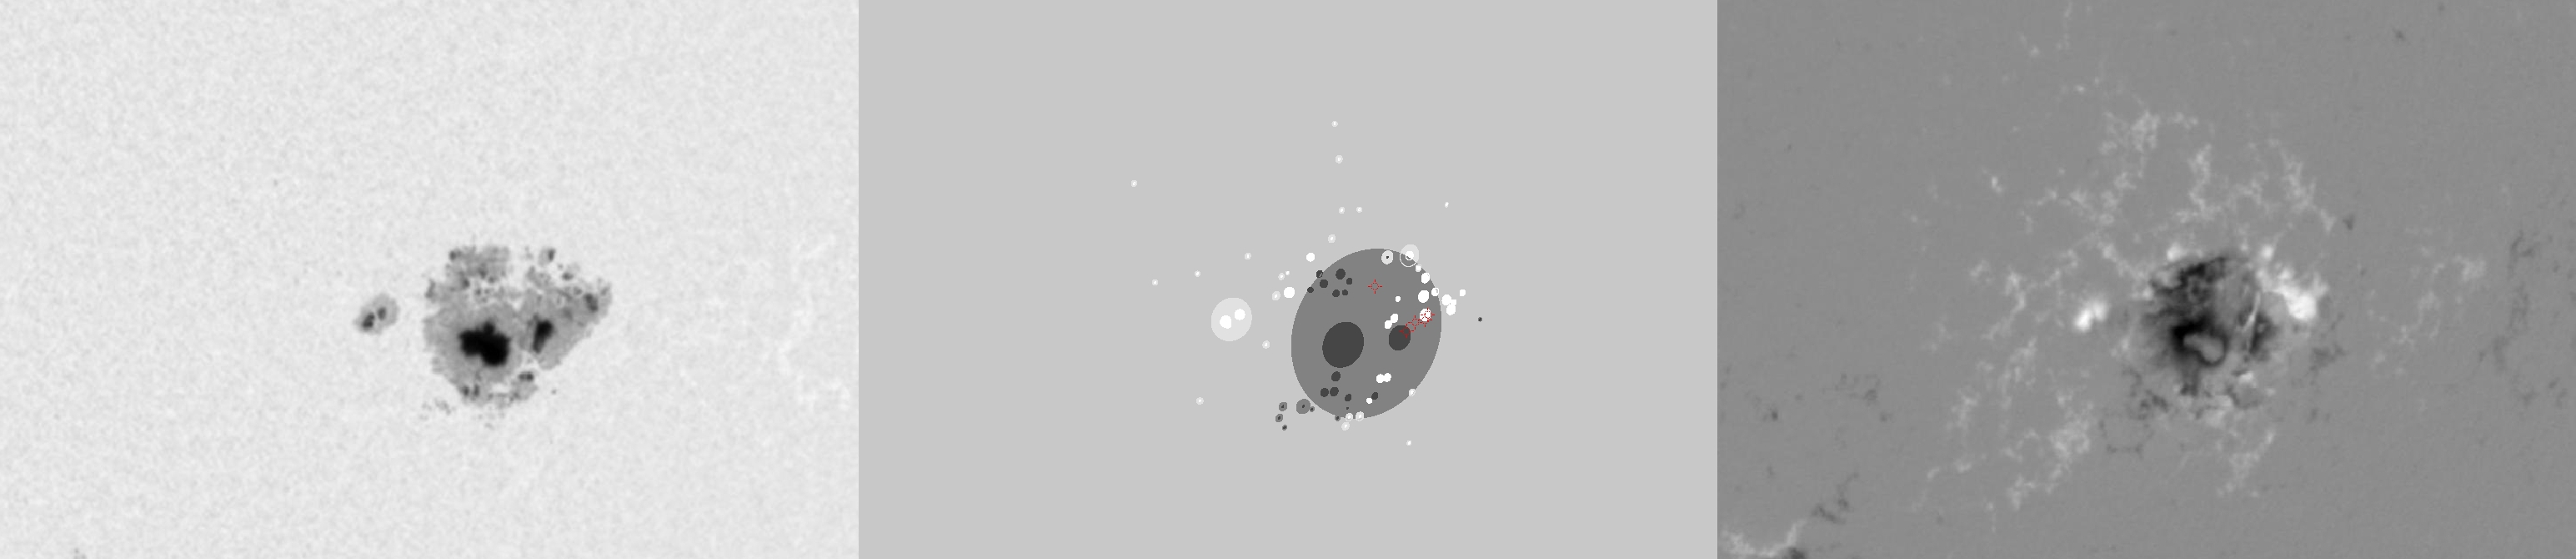
| Evolution of sunspot group NOAA 10069 and positions of flares in it animated by using the data of SOHO/MDI Debrecen Data (SDD) sunspot catalogue (lower panel, middle, ellipses with positions and areas corresponding to the relevant data of spots in SDD and with grey-scale colour coding of the magnetic polarities corresponding to that of the magnetograms), SOHO/MDI continuum images (lower panel, left) and magnetograms (lower panel, right), SOHO/EIT images (upper panel, middle), GOES and RHESSI flare data (red and blue symbols) observed within the interval around the time of SDD data. |
|
When you want to zoom in on one of the images, simply move the mouse pointer over that image. |
 |
| Year | Month | Day | Hour | Min | Sec | NOAA | Proj.U | Proj.WS | Corr.U | Corr.WS | B | L | LCM | Pos.angle | r | MU | MP |
|---|---|---|---|---|---|---|---|---|---|---|---|---|---|---|---|---|---|
| 2002 | 08 | 19 | 22 | 23 | 32 | 10069 | 655 | 4344 | 394 | 2617 | -8.12 | 301.50 | 31.28 | 244.79 | 0.5700 | -560.0 | -312.9 |
| Flare | Date | Start | Peak | End | Dur [s] | Peak [c/s] | Total Counts | Energy [keV] | X pos [asec] | Y pos [asec] | Radial [asec] | B [deg] | L [deg] | Flags |
|---|---|---|---|---|---|---|---|---|---|---|---|---|---|---|
| 2081970 | 19-Aug-2002 | 21:55:40 | 22:05:34 | 22:10:00 | 860 | 168 | 292095 | 12-25 | 550 | -221 | 593 | -7.73 | 304.91 | a0 A1 |
| 20819119 | 19-Aug-2002 | 22:12:48 | 22:13:02 | 22:17:48 | 300 | 45 | 56102 | 12-25 | 550 | -225 | 595 | -7.98 | 304.86 | A0 GS P1 |
| 20819120 | 19-Aug-2002 | 22:20:40 | 22:21:26 | 22:27:16 | 396 | 27 | 45948 | 12-25 | 538 | -233 | 587 | -8.41 | 303.95 | A0 |
| 20819156 | 19-Aug-2002 | 22:30:28 | 22:30:30 | 22:31:36 | 68 | 15 | 5643 | 6-12 | 547 | -226 | 592 | -8.03 | 304.48 | A0 |
| 2081935 | 19-Aug-2002 | 22:34:16 | 22:41:34 | 22:47:40 | 804 | 64 | 124059 | 12-25 | 520 | -199 | 557 | -6.23 | 302.27 | A0 a1 P1 PE |
| Date | Start | Peak | End | Classification | B [deg] | LCM [deg] |
|---|---|---|---|---|---|---|
| No data |

