move the mouse pointer over that image.
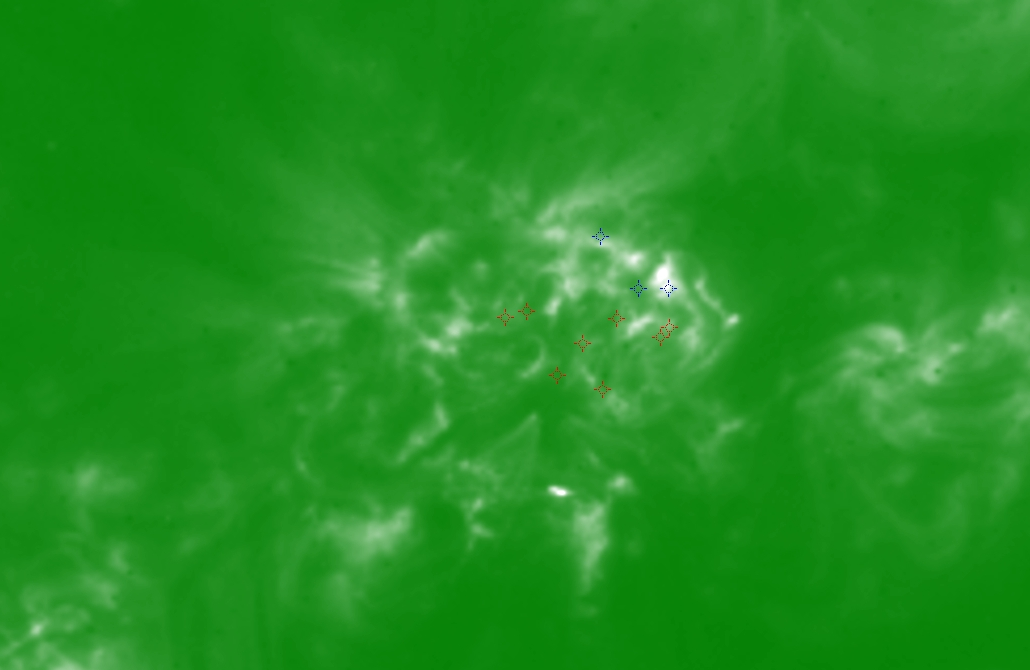
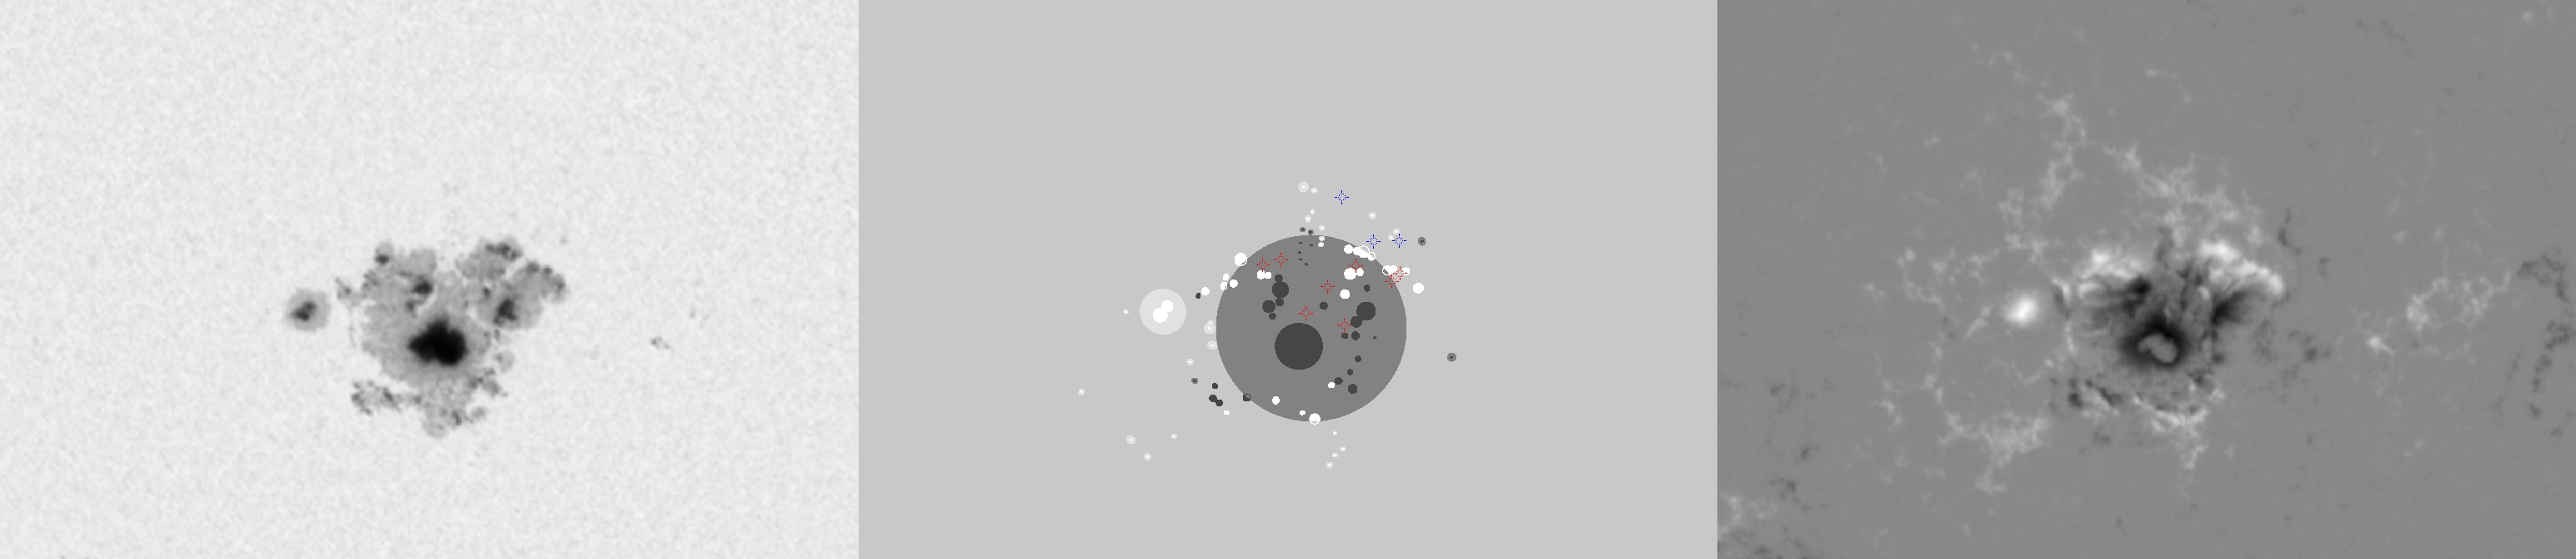
| Evolution of sunspot group NOAA 10069 and positions of flares in it animated by using the data of SOHO/MDI Debrecen Data (SDD) sunspot catalogue (lower panel, middle, ellipses with positions and areas corresponding to the relevant data of spots in SDD and with grey-scale colour coding of the magnetic polarities corresponding to that of the magnetograms), SOHO/MDI continuum images (lower panel, left) and magnetograms (lower panel, right), SOHO/EIT images (upper panel, middle), GOES and RHESSI flare data (red and blue symbols) observed within the interval around the time of SDD data. |
|
When you want to zoom in on one of the images, simply move the mouse pointer over that image. |
 |
| Year | Month | Day | Hour | Min | Sec | NOAA | Proj.U | Proj.WS | Corr.U | Corr.WS | B | L | LCM | Pos.angle | r | MU | MP |
|---|---|---|---|---|---|---|---|---|---|---|---|---|---|---|---|---|---|
| 2002 | 08 | 17 | 12 | 47 | 32 | 10069 | 844 | 5895 | 428 | 3022 | -7.73 | 300.83 | -1.11 | 175.98 | 0.2556 | -670.3 | -208.3 |
| Flare | Date | Start | Peak | End | Dur [s] | Peak [c/s] | Total Counts | Energy [keV] | X pos [asec] | Y pos [asec] | Radial [asec] | B [deg] | L [deg] | Flags |
|---|---|---|---|---|---|---|---|---|---|---|---|---|---|---|
| 2081755 | 17-Aug-2002 | 12:06:52 | 12:08:10 | 12:09:48 | 176 | 320 | 166464 | 6-12 | 13 | -242 | 242 | -7.85 | 302.39 | A0 ES P1 |
| 2081790 | 17-Aug-2002 | 12:25:32 | 12:27:50 | 12:36:08 | 636 | 320 | 681792 | 6-12 | -42 | -197 | 202 | -5.10 | 298.92 | A0 P1 PE Q2 |
| 20817125 | 17-Aug-2002 | 13:00:08 | 13:01:54 | 13:04:32 | 264 | 22 | 27060 | 6-12 | -18 | -193 | 194 | -4.85 | 300.04 | a0 A1 P1 PE |
| 2081728 | 17-Aug-2002 | 13:43:12 | 13:44:06 | 13:47:32 | 260 | 3824 | 4560600 | 12-25 | 78 | -209 | 223 | -5.85 | 305.39 | A0 ES P1 PE |
| 20817139 | 17-Aug-2002 | 13:47:32 | 13:54:26 | 14:09:12 | 1300 | 3824 | 24024192 | 12-25 | 87 | -203 | 221 | -5.49 | 305.84 | A0 |
| 20817126 | 17-Aug-2002 | 14:09:12 | 14:10:54 | 14:12:36 | 204 | 2800 | 2838144 | 12-25 | 59 | -197 | 206 | -5.11 | 304.00 | A0 GE P1 PE |
| 20817140 | 17-Aug-2002 | 14:42:20 | 14:44:02 | 14:44:48 | 148 | 60 | 42550 | 12-25 | 32 | -233 | 235 | -7.29 | 302.09 | a0 A1 |
| 2081729 | 17-Aug-2002 | 15:19:36 | 15:20:14 | 15:29:44 | 608 | 46 | 128064 | 12-25 | 59 | -213 | 221 | -6.08 | 303.37 | A0 |
| Date | Start | Peak | End | Classification | B [deg] | LCM [deg] |
|---|---|---|---|---|---|---|
| 17-Aug-2002 | 13:34 | 14:11 | 14:22 | C3.6 | -04 | 04 |
| 17-Aug-2002 | 14:21 | 14:27 | 14:32 | C4.1 | -04 | 03 |
| 17-Aug-2002 | 14:41 | 15:13 | 15:30 | C4.9 | -02 | 02 |

