move the mouse pointer over that image.
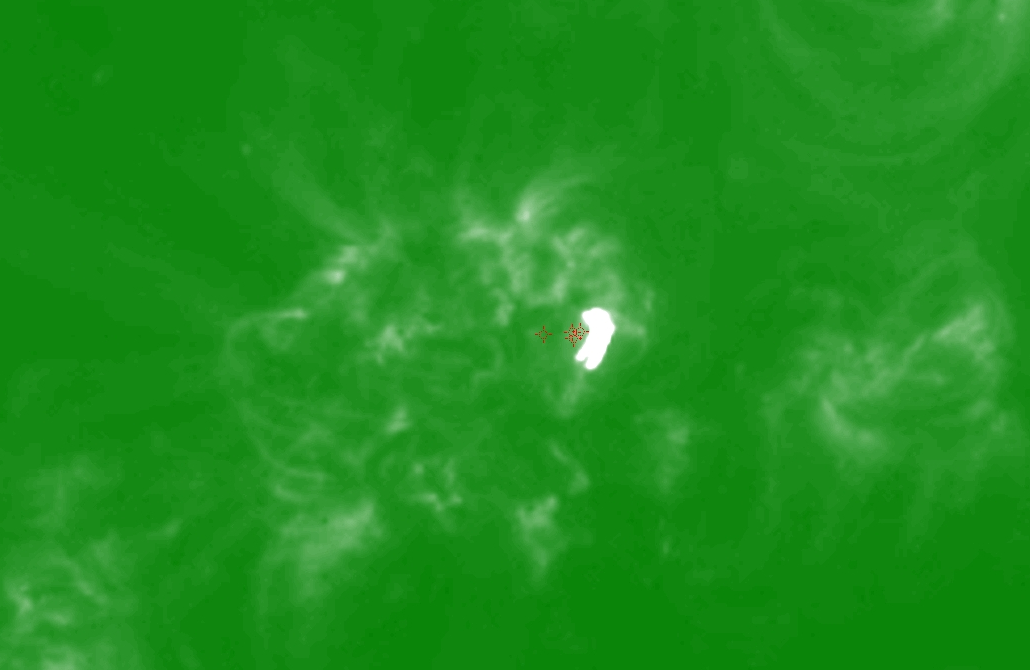
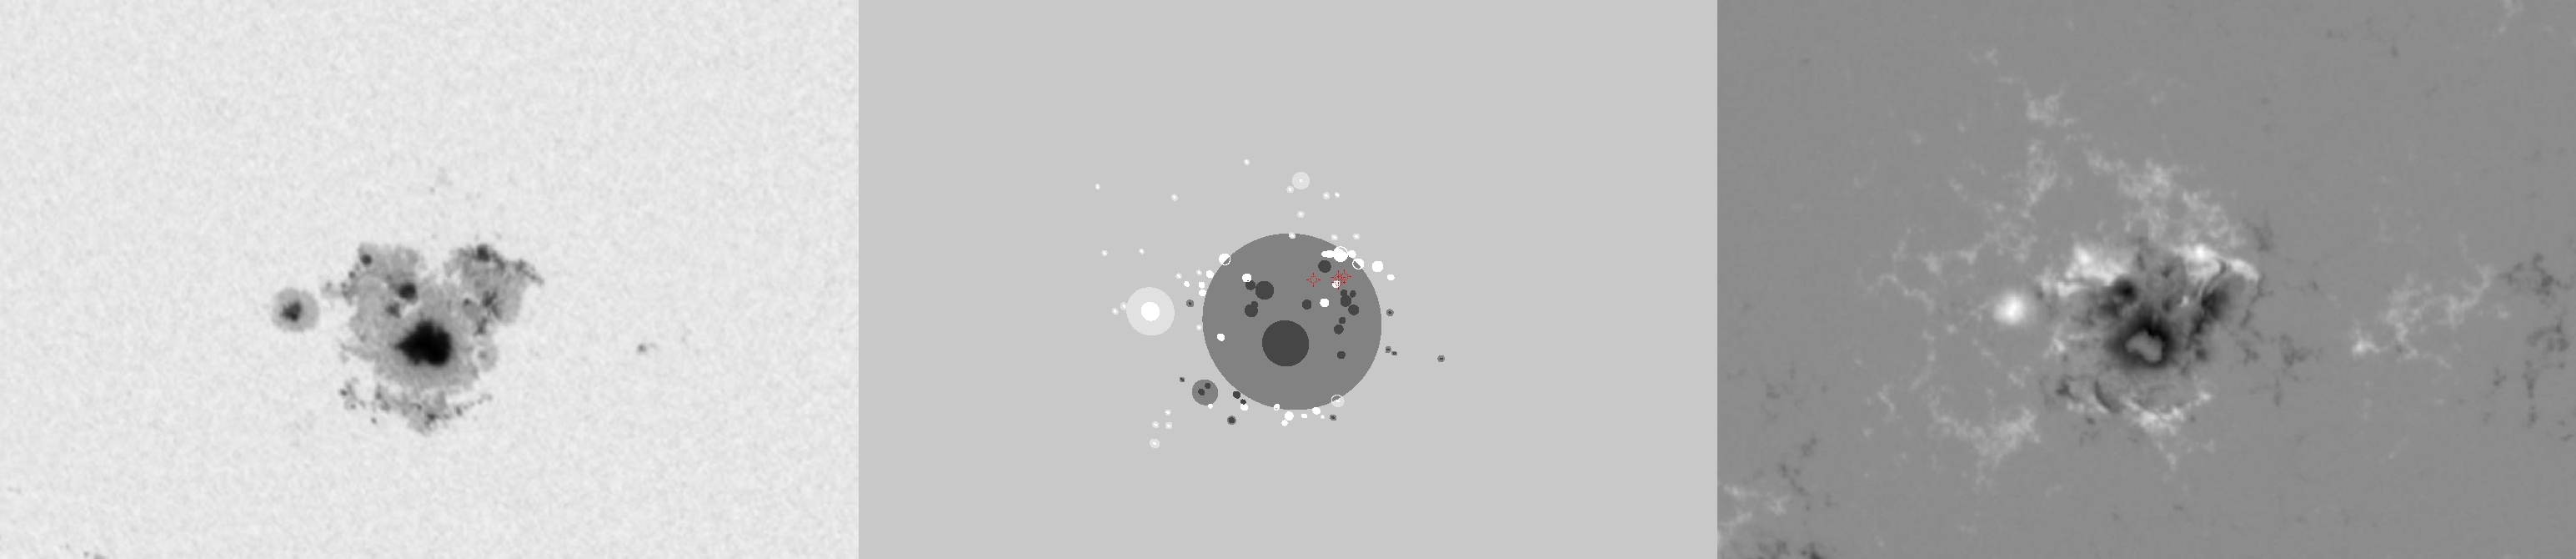
| Evolution of sunspot group NOAA 10069 and positions of flares in it animated by using the data of SOHO/MDI Debrecen Data (SDD) sunspot catalogue (lower panel, middle, ellipses with positions and areas corresponding to the relevant data of spots in SDD and with grey-scale colour coding of the magnetic polarities corresponding to that of the magnetograms), SOHO/MDI continuum images (lower panel, left) and magnetograms (lower panel, right), SOHO/EIT images (upper panel, middle), GOES and RHESSI flare data (red and blue symbols) observed within the interval around the time of SDD data. |
|
When you want to zoom in on one of the images, simply move the mouse pointer over that image. |
 |
| Year | Month | Day | Hour | Min | Sec | NOAA | Proj.U | Proj.WS | Corr.U | Corr.WS | B | L | LCM | Pos.angle | r | MU | MP |
|---|---|---|---|---|---|---|---|---|---|---|---|---|---|---|---|---|---|
| 2002 | 08 | 16 | 22 | 23 | 32 | 10069 | 783 | 5435 | 406 | 2824 | -7.57 | 300.45 | -9.43 | 146.82 | 0.2974 | -592.6 | -204.9 |
| Flare | Date | Start | Peak | End | Dur [s] | Peak [c/s] | Total Counts | Energy [keV] | X pos [asec] | Y pos [asec] | Radial [asec] | B [deg] | L [deg] | Flags |
|---|---|---|---|---|---|---|---|---|---|---|---|---|---|---|
| 2081609 | 16-Aug-2002 | 21:41:44 | 21:42:06 | 21:44:40 | 176 | 16 | 12648 | 12-25 | -113 | -208 | 237 | -5.84 | 302.78 | A1 |
| 2081610 | 16-Aug-2002 | 21:59:36 | 22:00:26 | 22:05:04 | 328 | 24 | 29904 | 12-25 | -108 | -204 | 231 | -5.59 | 302.92 | A1 |
| 2081612 | 16-Aug-2002 | 22:21:12 | 22:21:42 | 22:23:24 | 132 | 22 | 11424 | 12-25 | -120 | -206 | 239 | -5.72 | 302.00 | A1 |
| 2081667 | 16-Aug-2002 | 22:23:24 | 22:24:58 | 22:27:52 | 268 | 28 | 28032 | 12-25 | -96 | -204 | 225 | -5.58 | 303.42 | A1 P1 PE |
| Date | Start | Peak | End | Classification | B [deg] | LCM [deg] |
|---|---|---|---|---|---|---|
| No data |

