move the mouse pointer over that image.
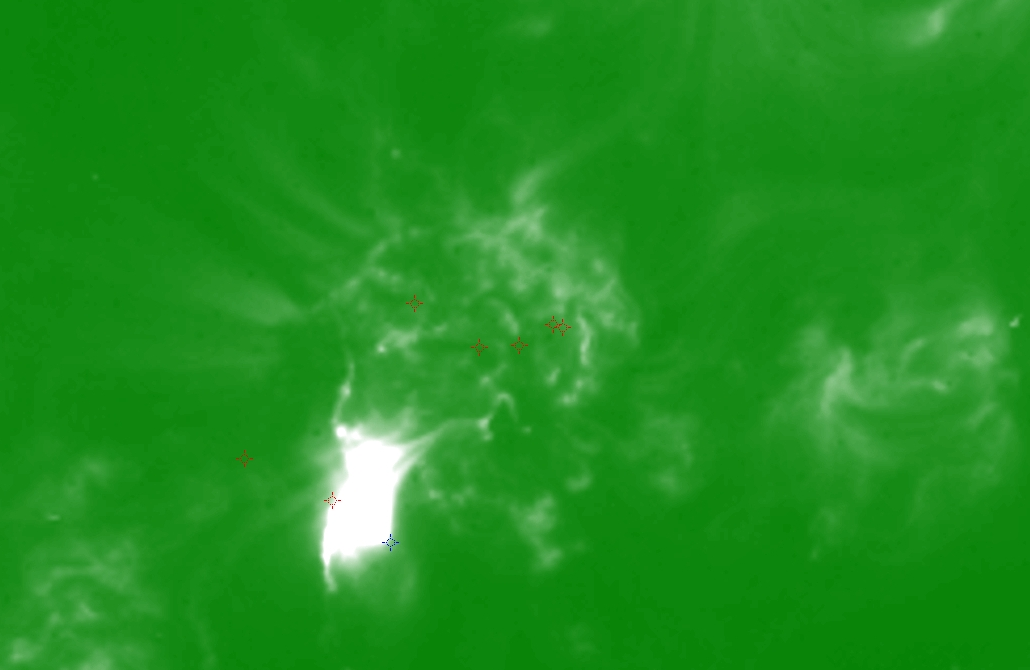
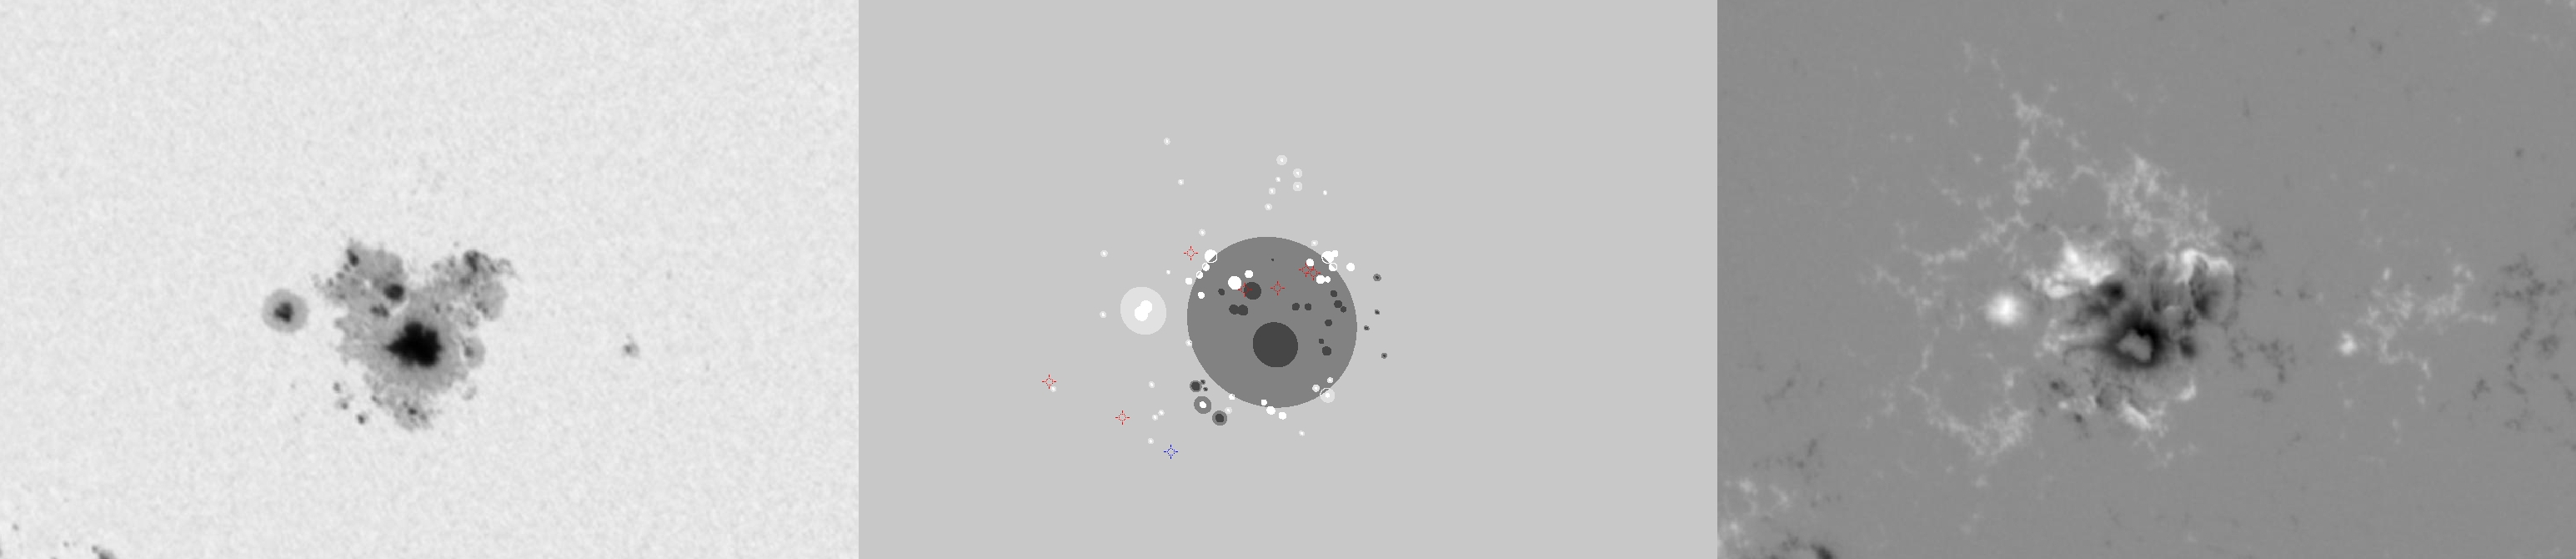
| Evolution of sunspot group NOAA 10069 and positions of flares in it animated by using the data of SOHO/MDI Debrecen Data (SDD) sunspot catalogue (lower panel, middle, ellipses with positions and areas corresponding to the relevant data of spots in SDD and with grey-scale colour coding of the magnetic polarities corresponding to that of the magnetograms), SOHO/MDI continuum images (lower panel, left) and magnetograms (lower panel, right), SOHO/EIT images (upper panel, middle), GOES and RHESSI flare data (red and blue symbols) observed within the interval around the time of SDD data. |
|
When you want to zoom in on one of the images, simply move the mouse pointer over that image. |
 |
| Year | Month | Day | Hour | Min | Sec | NOAA | Proj.U | Proj.WS | Corr.U | Corr.WS | B | L | LCM | Pos.angle | r | MU | MP |
|---|---|---|---|---|---|---|---|---|---|---|---|---|---|---|---|---|---|
| 2002 | 08 | 16 | 11 | 11 | 32 | 10069 | 663 | 4983 | 355 | 2655 | -7.64 | 300.06 | -15.98 | 131.81 | 0.3685 | -574.1 | -184.1 |
| Flare | Date | Start | Peak | End | Dur [s] | Peak [c/s] | Total Counts | Energy [keV] | X pos [asec] | Y pos [asec] | Radial [asec] | B [deg] | L [deg] | Flags |
|---|---|---|---|---|---|---|---|---|---|---|---|---|---|---|
| 2081601 | 16-Aug-2002 | 10:49:36 | 10:50:26 | 10:52:20 | 164 | 38 | 18984 | 12-25 | -219 | -198 | 295 | -5.39 | 302.34 | A1 P1 PE |
| 2081628 | 16-Aug-2002 | 11:14:12 | 11:16:54 | 11:19:56 | 344 | 36 | 40080 | 12-25 | -217 | -196 | 293 | -5.26 | 302.22 | A1 P1 PE |
| 2081668 | 16-Aug-2002 | 12:06:04 | 12:21:18 | 12:31:56 | 1552 | 3440 | 20782080 | 50-100 | -337 | -308 | 457 | -12.45 | 293.70 | A1 GD GE GS P1 PE |
| 2081603 | 16-Aug-2002 | 13:38:24 | 13:46:54 | 14:06:16 | 1672 | 416 | 1091448 | 25-50 | -194 | -211 | 287 | -6.13 | 302.23 | A1 P1 PE |
| 2081658 | 16-Aug-2002 | 14:06:16 | 14:07:46 | 14:08:32 | 136 | 60 | 42672 | 6-12 | -363 | -283 | 461 | -10.96 | 291.15 | A1 P1 PE |
| 2081630 | 16-Aug-2002 | 15:14:44 | 15:16:54 | 15:26:20 | 696 | 176 | 265584 | 12-25 | -192 | -213 | 287 | -6.25 | 301.52 | A1 P1 PE |
| 2081633 | 16-Aug-2002 | 15:40:32 | 15:44:38 | 15:46:00 | 328 | 168 | 155808 | 12-25 | -225 | -186 | 292 | -4.66 | 299.28 | A1 P1 PE |
| Date | Start | Peak | End | Classification | B [deg] | LCM [deg] |
|---|---|---|---|---|---|---|
| 16-Aug-2002 | 11:32 | 12:32 | 13:07 | M5.2 | -14 | -20 |

