
move the mouse pointer over that image.
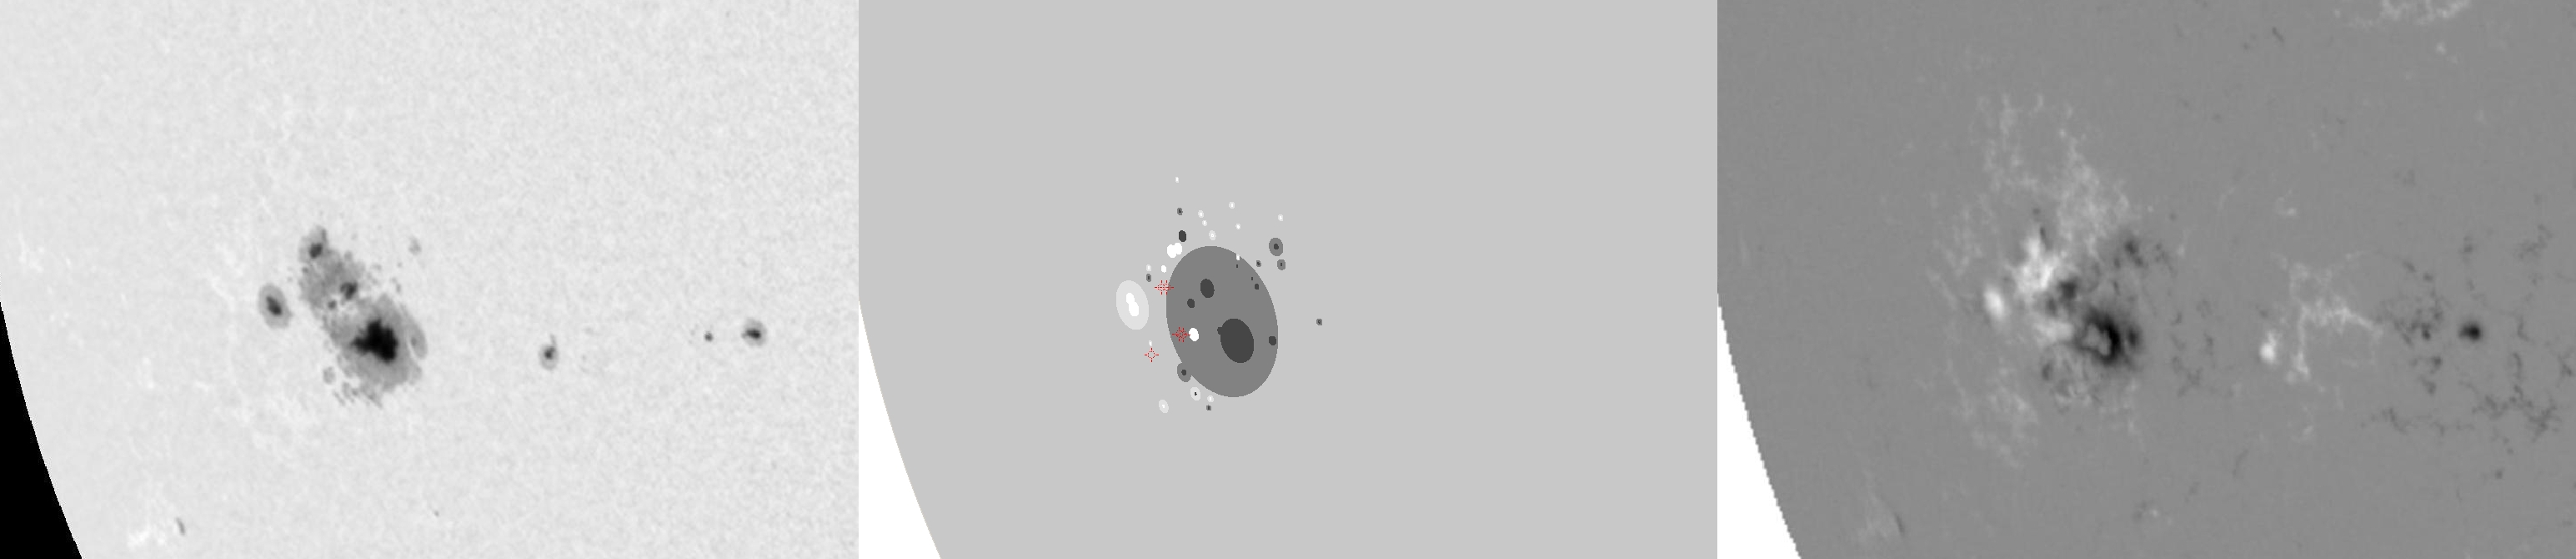
| Evolution of sunspot group NOAA 10069 and positions of flares in it animated by using the data of SOHO/MDI Debrecen Data (SDD) sunspot catalogue (lower panel, middle, ellipses with positions and areas corresponding to the relevant data of spots in SDD and with grey-scale colour coding of the magnetic polarities corresponding to that of the magnetograms), SOHO/MDI continuum images (lower panel, left) and magnetograms (lower panel, right), SOHO/EIT images (upper panel, middle), GOES and RHESSI flare data (red and blue symbols) observed within the interval around the time of SDD data. |
|
When you want to zoom in on one of the images, simply move the mouse pointer over that image. |
 |
| Year | Month | Day | Hour | Min | Sec | NOAA | Proj.U | Proj.WS | Corr.U | Corr.WS | B | L | LCM | Pos.angle | r | MU | MP |
|---|---|---|---|---|---|---|---|---|---|---|---|---|---|---|---|---|---|
| 2002 | 08 | 14 | 07 | 59 | 32 | 10069 | 376 | 2944 | 273 | 2145 | -7.70 | 299.28 | -44.98 | 107.00 | 0.7345 | -563.7 | -84.1 |
| Flare | Date | Start | Peak | End | Dur [s] | Peak [c/s] | Total Counts | Energy [keV] | X pos [asec] | Y pos [asec] | Radial [asec] | B [deg] | L [deg] | Flags |
|---|---|---|---|---|---|---|---|---|---|---|---|---|---|---|
| 20814130 | 14-Aug-2002 | 07:19:08 | 07:20:46 | 07:27:28 | 500 | 592 | 730848 | 12-25 | -697 | -217 | 730 | -8.62 | 296.77 | A0 |
| 20814101 | 14-Aug-2002 | 07:30:56 | 07:37:02 | 07:49:48 | 1132 | 848 | 2207424 | 12-25 | -691 | -218 | 725 | -8.64 | 297.15 | A0 |
| 2081417 | 14-Aug-2002 | 07:49:48 | 07:52:10 | 07:53:36 | 228 | 272 | 230688 | 6-12 | -704 | -183 | 727 | -6.57 | 296.16 | A0 |
| 2081464 | 14-Aug-2002 | 07:53:36 | 07:57:26 | 08:03:32 | 596 | 1200 | 1559232 | 12-25 | -699 | -183 | 722 | -6.53 | 296.56 | A0 P1 PE |
| 2081479 | 14-Aug-2002 | 08:39:24 | 08:40:22 | 08:46:56 | 452 | 5 | 8225 | 12-25 | -702 | -235 | 740 | -9.78 | 295.38 | A0 |
| 20814131 | 14-Aug-2002 | 08:46:56 | 09:03:54 | 09:16:00 | 1744 | 208 | 385666 | 12-25 | -479 | 108 | 491 | 12.10 | 312.37 | a0 A1 GD P1 PE |
| Date | Start | Peak | End | Classification | B [deg] | LCM [deg] |
|---|---|---|---|---|---|---|
| No data |

