move the mouse pointer over that image.
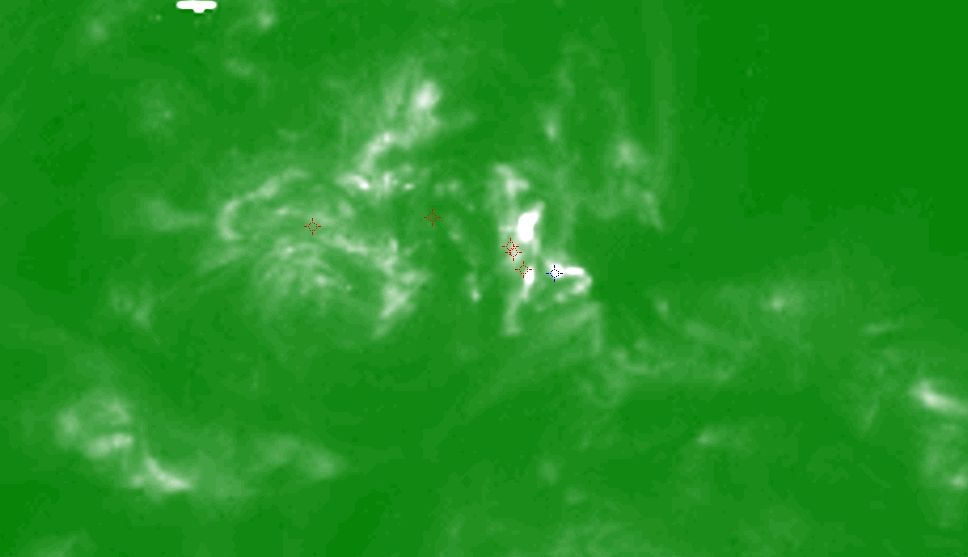
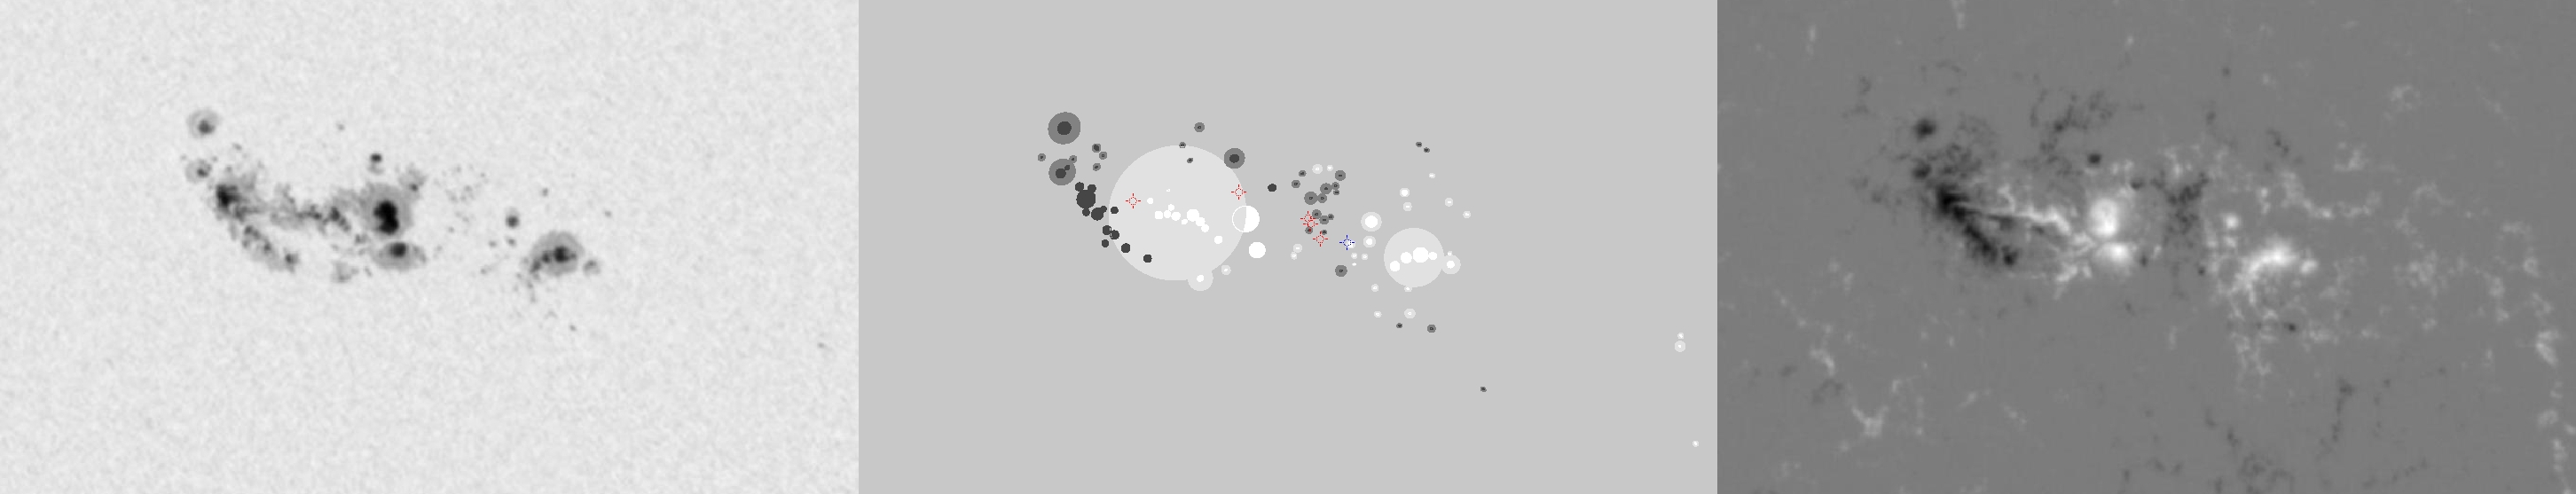
| Evolution of sunspot group NOAA 10030 and positions of flares in it animated by using the data of SOHO/MDI Debrecen Data (SDD) sunspot catalogue (lower panel, middle, ellipses with positions and areas corresponding to the relevant data of spots in SDD and with grey-scale colour coding of the magnetic polarities corresponding to that of the magnetograms), SOHO/MDI continuum images (lower panel, left) and magnetograms (lower panel, right), SOHO/EIT images (upper panel, middle), GOES and RHESSI flare data (red and blue symbols) observed within the interval around the time of SDD data. |
|
When you want to zoom in on one of the images, simply move the mouse pointer over that image. |
 |
| Year | Month | Day | Hour | Min | Sec | NOAA | Proj.U | Proj.WS | Corr.U | Corr.WS | B | L | LCM | Pos.angle | r | MU | MP |
|---|---|---|---|---|---|---|---|---|---|---|---|---|---|---|---|---|---|
| 2002 | 07 | 15 | 13 | 44 | 32 | 10030 | 500 | 3783 | 259 | 1962 | 18.84 | 11.19 | -6.90 | 24.55 | 0.2746 | 380.9 | 99.8 |
| Flare | Date | Start | Peak | End | Dur [s] | Peak [c/s] | Total Counts | Energy [keV] | X pos [asec] | Y pos [asec] | Radial [asec] | B [deg] | L [deg] | Flags |
|---|---|---|---|---|---|---|---|---|---|---|---|---|---|---|
| 2071591 | 15-Jul-2002 | 12:23:20 | 12:24:22 | 12:29:40 | 380 | 111 | 165273 | 12-25 | -55 | 246 | 252 | 19.05 | 14.45 | A0 a1 ES GE P1 PE |
| 2071518 | 15-Jul-2002 | 12:52:56 | 12:53:14 | 13:00:48 | 472 | 103 | 59273 | 6-12 | -45 | 242 | 246 | 18.81 | 14.82 | A0 GS P1 |
| 2071592 | 15-Jul-2002 | 13:01:40 | 13:02:22 | 13:02:44 | 64 | 11 | 3478 | 6-12 | -168 | 258 | 308 | 19.73 | 6.89 | A0 |
| 20715126 | 15-Jul-2002 | 13:18:00 | 13:19:26 | 13:21:28 | 208 | 7 | 5339 | 6-12 | -88 | 264 | 279 | 20.16 | 11.82 | A0 |
| 2071519 | 15-Jul-2002 | 13:59:40 | 14:03:02 | 14:11:00 | 680 | 152 | 216943 | 12-25 | -18 | 231 | 232 | 18.15 | 15.88 | a0 A1 ES GE P1 PE |
| Date | Start | Peak | End | Classification | B [deg] | LCM [deg] |
|---|---|---|---|---|---|---|
| 15-Jul-2002 | 14:00 | 14:04 | 14:10 | C3.6 | 18 | -01 |

