move the mouse pointer over that image.
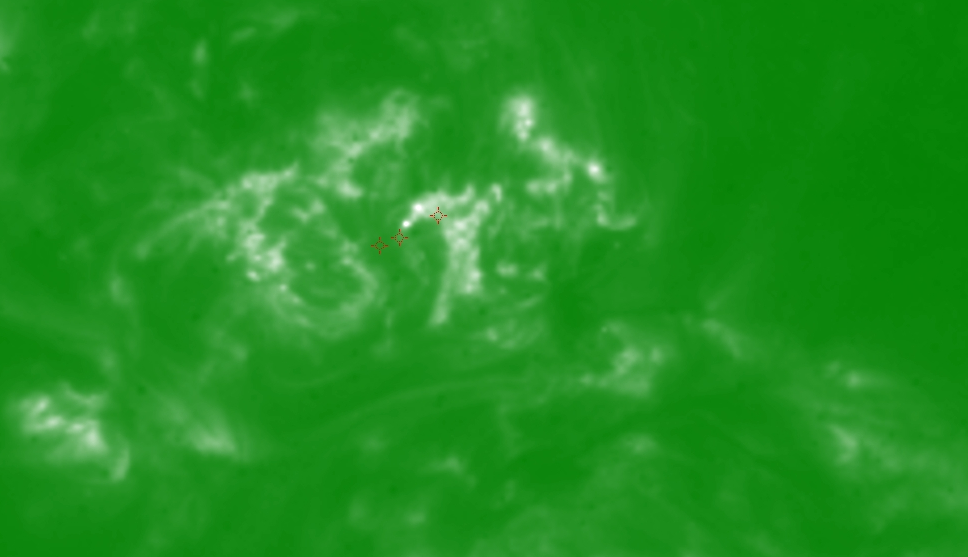
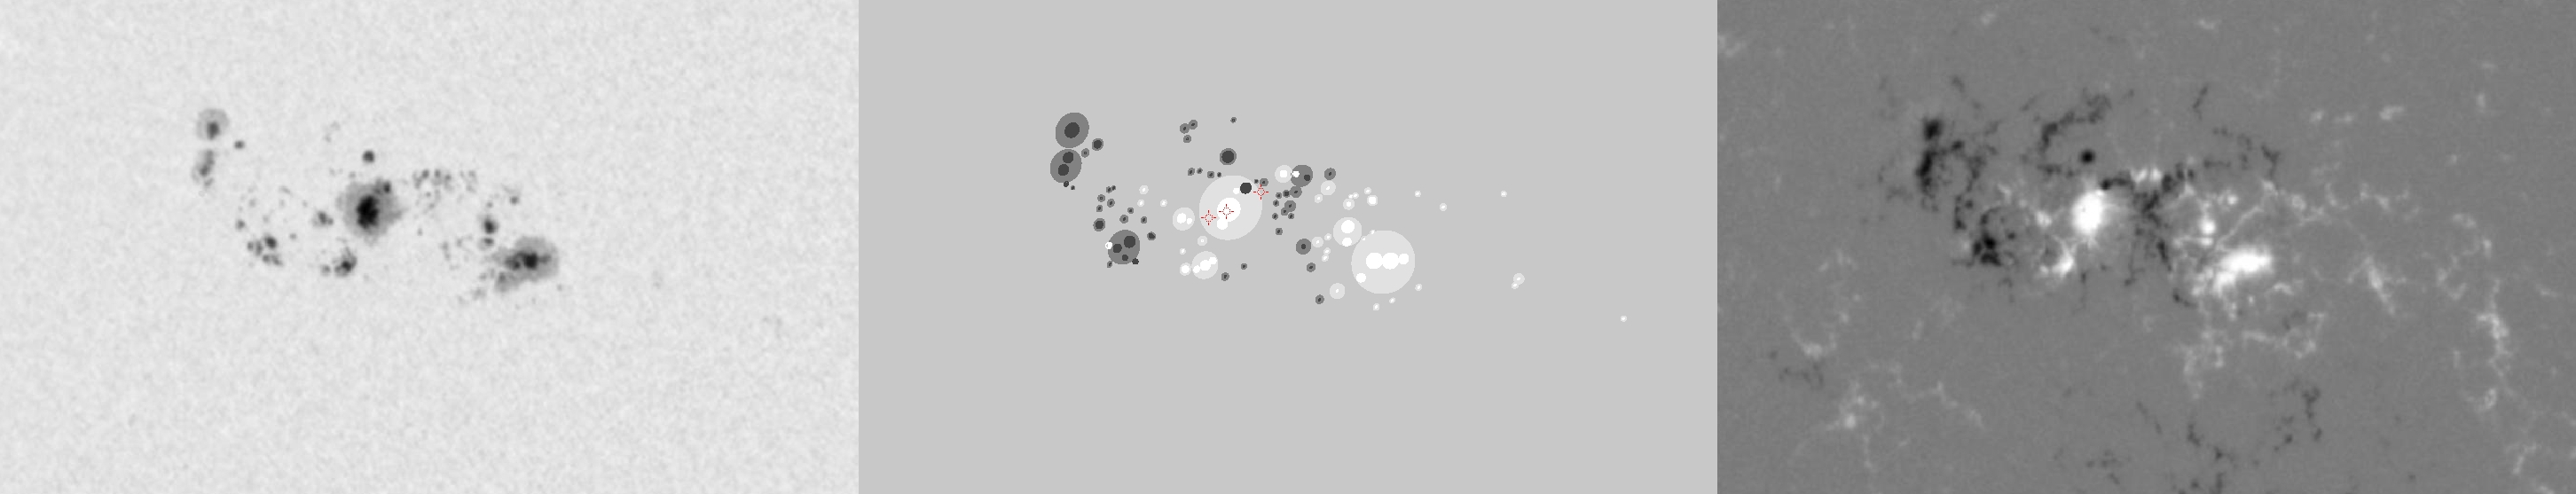
| Evolution of sunspot group NOAA 10030 and positions of flares in it animated by using the data of SOHO/MDI Debrecen Data (SDD) sunspot catalogue (lower panel, middle, ellipses with positions and areas corresponding to the relevant data of spots in SDD and with grey-scale colour coding of the magnetic polarities corresponding to that of the magnetograms), SOHO/MDI continuum images (lower panel, left) and magnetograms (lower panel, right), SOHO/EIT images (upper panel, middle), GOES and RHESSI flare data (red and blue symbols) observed within the interval around the time of SDD data. |
|
When you want to zoom in on one of the images, simply move the mouse pointer over that image. |
 |
| Year | Month | Day | Hour | Min | Sec | NOAA | Proj.U | Proj.WS | Corr.U | Corr.WS | B | L | LCM | Pos.angle | r | MU | MP |
|---|---|---|---|---|---|---|---|---|---|---|---|---|---|---|---|---|---|
| 2002 | 07 | 14 | 09 | 35 | 32 | 10030 | 423 | 2438 | 230 | 1336 | 18.95 | 13.28 | -20.35 | 50.90 | 0.4197 | 606.2 | 238.3 |
| Flare | Date | Start | Peak | End | Dur [s] | Peak [c/s] | Total Counts | Energy [keV] | X pos [asec] | Y pos [asec] | Radial [asec] | B [deg] | L [deg] | Flags |
|---|---|---|---|---|---|---|---|---|---|---|---|---|---|---|
| 2071465 | 14-Jul-2002 | 08:18:24 | 08:26:26 | 08:28:20 | 596 | 120 | 143376 | 6-12 | -335 | 256 | 422 | 19.28 | 11.71 | A0 |
| 20714107 | 14-Jul-2002 | 08:28:20 | 08:31:22 | 08:31:48 | 208 | 76 | 46320 | 6-12 | -346 | 251 | 428 | 18.95 | 10.96 | A0 |
| 20714108 | 14-Jul-2002 | 10:03:00 | 10:04:46 | 10:08:12 | 312 | 72 | 59832 | 6-12 | -284 | 269 | 392 | 20.17 | 14.12 | A0 |
| Date | Start | Peak | End | Classification | B [deg] | LCM [deg] |
|---|---|---|---|---|---|---|
| No data |

