move the mouse pointer over that image.
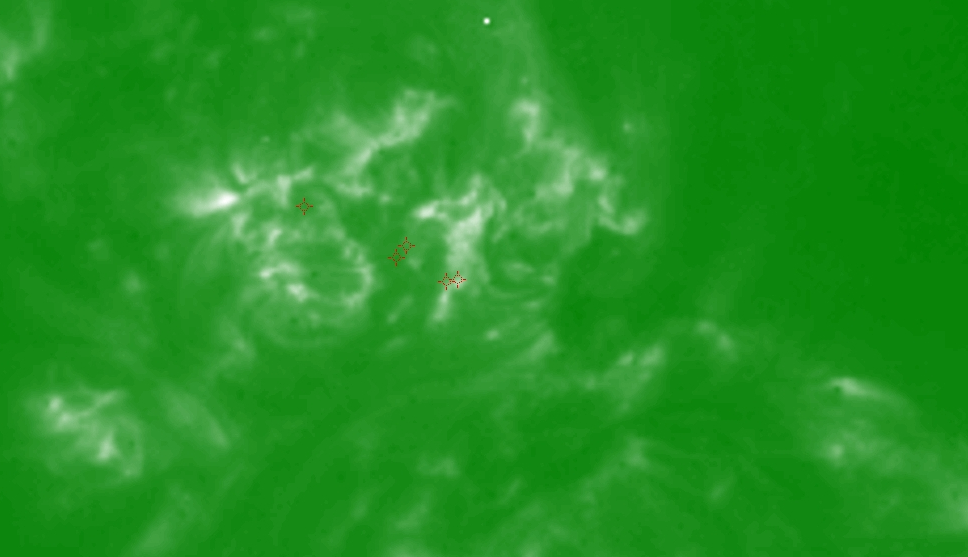
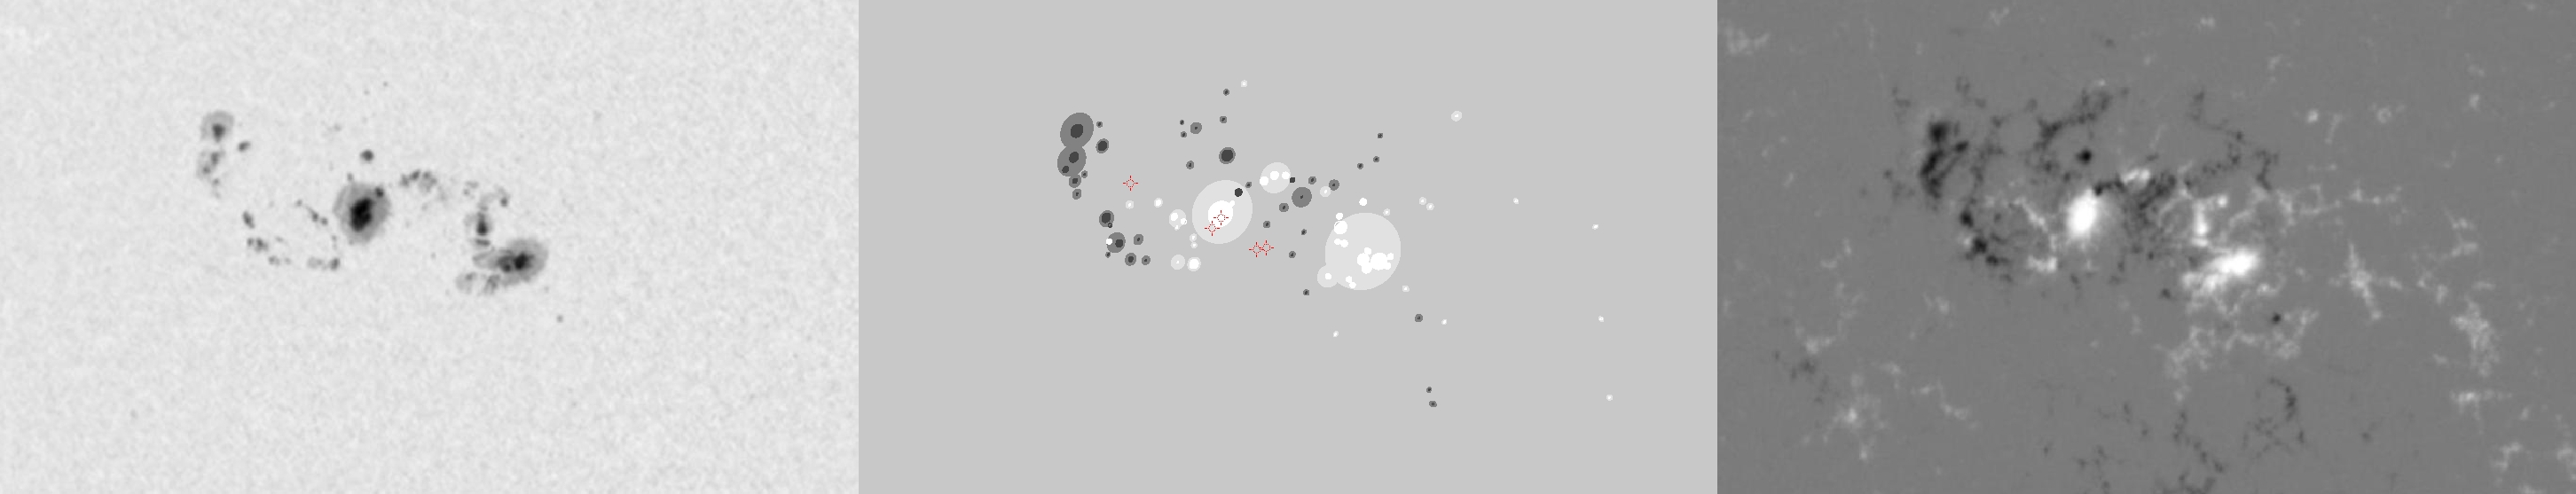
| Evolution of sunspot group NOAA 10030 and positions of flares in it animated by using the data of SOHO/MDI Debrecen Data (SDD) sunspot catalogue (lower panel, middle, ellipses with positions and areas corresponding to the relevant data of spots in SDD and with grey-scale colour coding of the magnetic polarities corresponding to that of the magnetograms), SOHO/MDI continuum images (lower panel, left) and magnetograms (lower panel, right), SOHO/EIT images (upper panel, middle), GOES and RHESSI flare data (red and blue symbols) observed within the interval around the time of SDD data. |
|
When you want to zoom in on one of the images, simply move the mouse pointer over that image. |
 |
| Year | Month | Day | Hour | Min | Sec | NOAA | Proj.U | Proj.WS | Corr.U | Corr.WS | B | L | LCM | Pos.angle | r | MU | MP |
|---|---|---|---|---|---|---|---|---|---|---|---|---|---|---|---|---|---|
| 2002 | 07 | 14 | 01 | 35 | 32 | 10030 | 377 | 2290 | 214 | 1289 | 19.05 | 13.71 | -24.33 | 55.44 | 0.4700 | 711.0 | 214.4 |
| Flare | Date | Start | Peak | End | Dur [s] | Peak [c/s] | Total Counts | Energy [keV] | X pos [asec] | Y pos [asec] | Radial [asec] | B [deg] | L [deg] | Flags |
|---|---|---|---|---|---|---|---|---|---|---|---|---|---|---|
| 2071401 | 14-Jul-2002 | 01:03:08 | 01:05:46 | 01:10:04 | 416 | 120 | 95544 | 12-25 | -396 | 246 | 466 | 18.52 | 11.68 | A0 |
| 20714102 | 14-Jul-2002 | 01:10:04 | 01:11:26 | 01:17:24 | 440 | 18 | 39384 | 6-12 | -363 | 231 | 430 | 17.67 | 14.03 | A0 P1 PE |
| 2071448 | 14-Jul-2002 | 01:17:24 | 01:22:58 | 01:31:16 | 832 | 36 | 98208 | 6-12 | -353 | 232 | 423 | 17.75 | 14.59 | A0 |
| 20714103 | 14-Jul-2002 | 01:31:16 | 01:34:26 | 01:40:40 | 564 | 24 | 50976 | 6-12 | -382 | 253 | 458 | 18.98 | 12.32 | A0 |
| 20714104 | 14-Jul-2002 | 01:57:12 | 01:57:42 | 01:58:56 | 104 | 24 | 9936 | 6-12 | -441 | 277 | 521 | 20.33 | 7.66 | A0 P1 PE |
| Date | Start | Peak | End | Classification | B [deg] | LCM [deg] |
|---|---|---|---|---|---|---|
| No data |

