move the mouse pointer over that image.
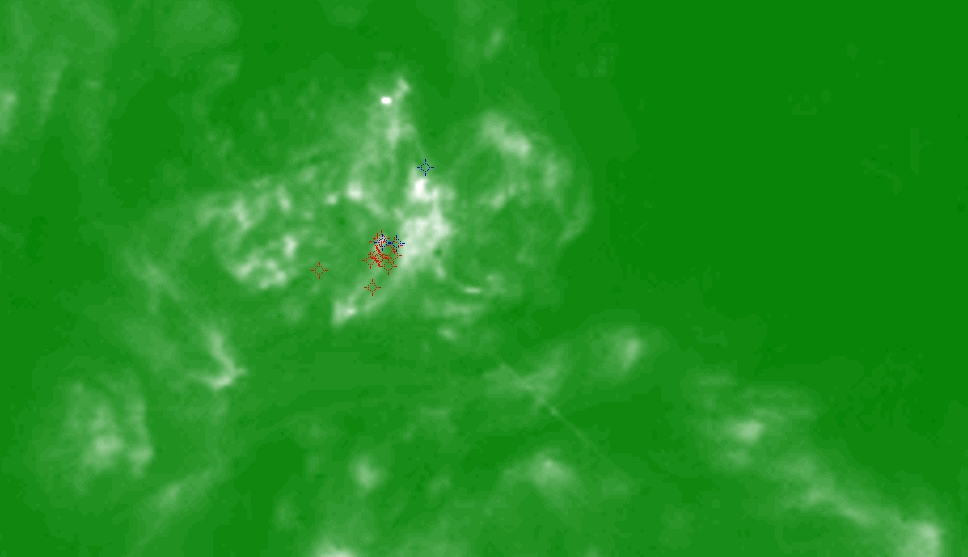
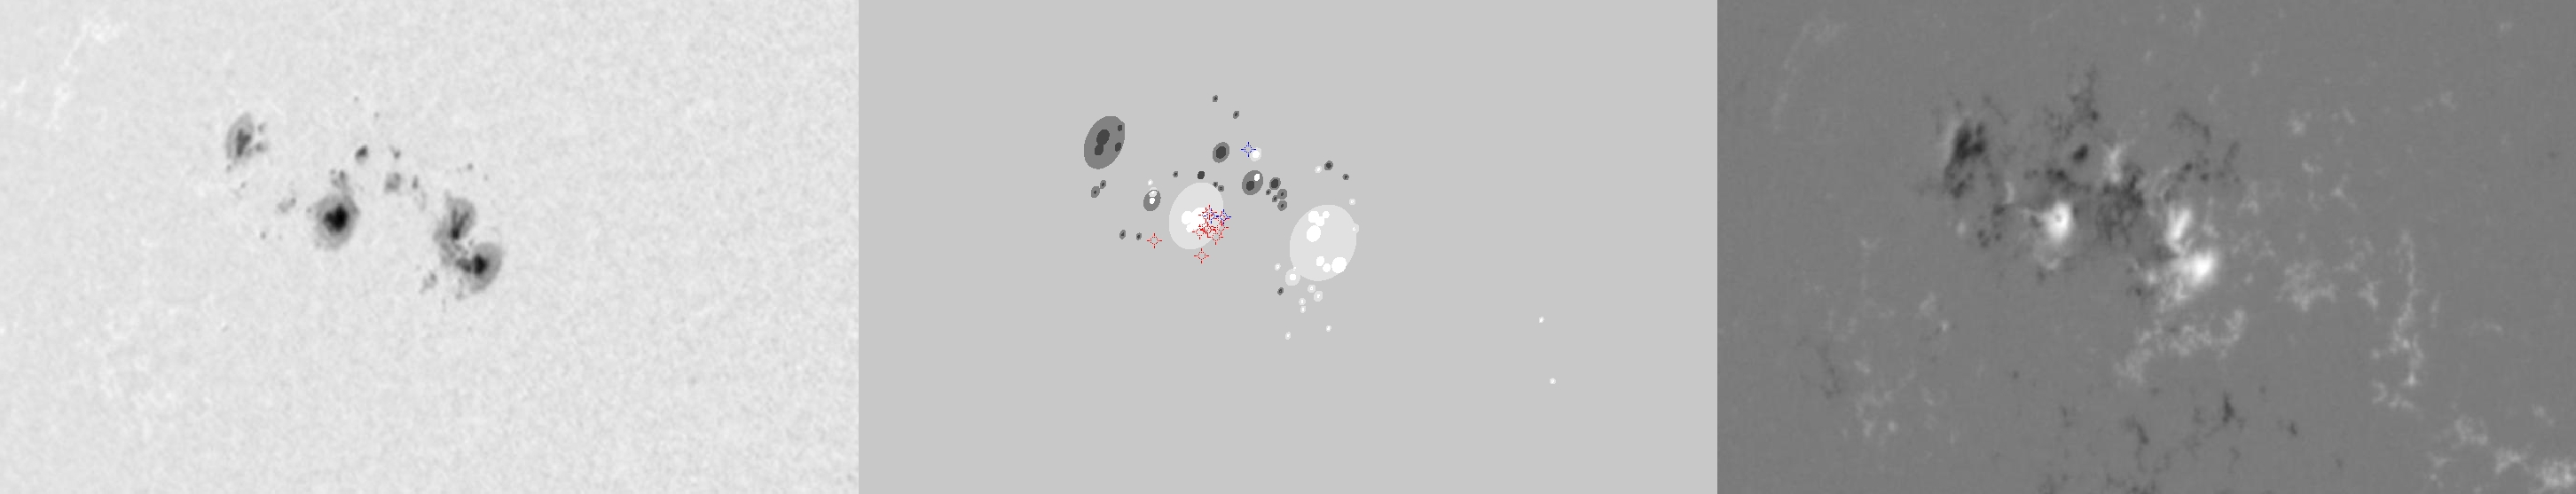
| Evolution of sunspot group NOAA 10030 and positions of flares in it animated by using the data of SOHO/MDI Debrecen Data (SDD) sunspot catalogue (lower panel, middle, ellipses with positions and areas corresponding to the relevant data of spots in SDD and with grey-scale colour coding of the magnetic polarities corresponding to that of the magnetograms), SOHO/MDI continuum images (lower panel, left) and magnetograms (lower panel, right), SOHO/EIT images (upper panel, middle), GOES and RHESSI flare data (red and blue symbols) observed within the interval around the time of SDD data. |
|
When you want to zoom in on one of the images, simply move the mouse pointer over that image. |
 |
| Year | Month | Day | Hour | Min | Sec | NOAA | Proj.U | Proj.WS | Corr.U | Corr.WS | B | L | LCM | Pos.angle | r | MU | MP |
|---|---|---|---|---|---|---|---|---|---|---|---|---|---|---|---|---|---|
| 2002 | 07 | 12 | 22 | 23 | 32 | 10030 | 274 | 1809 | 180 | 1204 | 19.26 | 13.42 | -39.62 | 65.19 | 0.6618 | 541.4 | 147.5 |
| Flare | Date | Start | Peak | End | Dur [s] | Peak [c/s] | Total Counts | Energy [keV] | X pos [asec] | Y pos [asec] | Radial [asec] | B [deg] | L [deg] | Flags |
|---|---|---|---|---|---|---|---|---|---|---|---|---|---|---|
| 2071242 | 12-Jul-2002 | 21:44:48 | 21:46:10 | 21:47:44 | 176 | 26 | 17832 | 6-12 | -591 | 254 | 643 | 18.38 | 12.12 | A0 P1 PE |
| 20712117 | 12-Jul-2002 | 21:47:44 | 21:53:58 | 21:57:52 | 608 | 26 | 66840 | 6-12 | -580 | 256 | 634 | 18.54 | 12.91 | A0 P1 PE |
| 20712101 | 12-Jul-2002 | 21:57:52 | 22:00:10 | 22:01:48 | 236 | 28 | 26448 | 6-12 | -578 | 262 | 635 | 18.91 | 12.91 | A0 P1 PE |
| 2071215 | 12-Jul-2002 | 22:01:48 | 22:04:42 | 22:11:48 | 600 | 1008 | 628200 | 12-25 | -581 | 249 | 632 | 18.11 | 12.85 | A0 P1 PE |
| 20712102 | 12-Jul-2002 | 22:15:12 | 22:18:26 | 22:20:08 | 296 | 80 | 56376 | 6-12 | -622 | 246 | 669 | 17.78 | 9.40 | A0 |
| 20712118 | 12-Jul-2002 | 22:20:08 | 22:21:26 | 22:25:52 | 344 | 104 | 78840 | 6-12 | -582 | 266 | 640 | 19.14 | 12.32 | A0 |
| 20712119 | 12-Jul-2002 | 22:25:52 | 22:27:10 | 22:31:24 | 332 | 26 | 31848 | 6-12 | -583 | 264 | 641 | 19.02 | 12.22 | A0 |
| 2071257 | 12-Jul-2002 | 23:21:32 | 23:25:42 | 23:29:44 | 492 | 87 | 92336 | 12-25 | -569 | 253 | 623 | 18.40 | 13.00 | A0 P1 PE |
| 2071216 | 12-Jul-2002 | 23:29:44 | 23:31:22 | 23:35:28 | 344 | 11 | 11519 | 12-25 | -569 | 255 | 624 | 18.52 | 12.91 | A0 P1 PE |
| 2071258 | 12-Jul-2002 | 23:35:28 | 23:44:50 | 23:49:44 | 856 | 23 | 38267 | 12-25 | -570 | 251 | 623 | 18.27 | 12.77 | A0 P1 PE |
| 2071234 | 13-Jul-2002 | 00:05:08 | 00:08:26 | 00:25:24 | 1216 | 352 | 1200272 | 12-25 | -563 | 234 | 610 | 17.26 | 13.37 | a0 A1 EE P1 PE |
| Date | Start | Peak | End | Classification | B [deg] | LCM [deg] |
|---|---|---|---|---|---|---|
| 12-Jul-2002 | 22:02 | 22:05 | 22:07 | B8.3 | 19 | -40 |
| 12-Jul-2002 | 23:21 | 23:26 | 23:30 | C2.1 | 19 | -40 |
| 13-Jul-2002 | 00:44 | 00:50 | 00:55 | C6.7 | 22 | -38 |

