move the mouse pointer over that image.
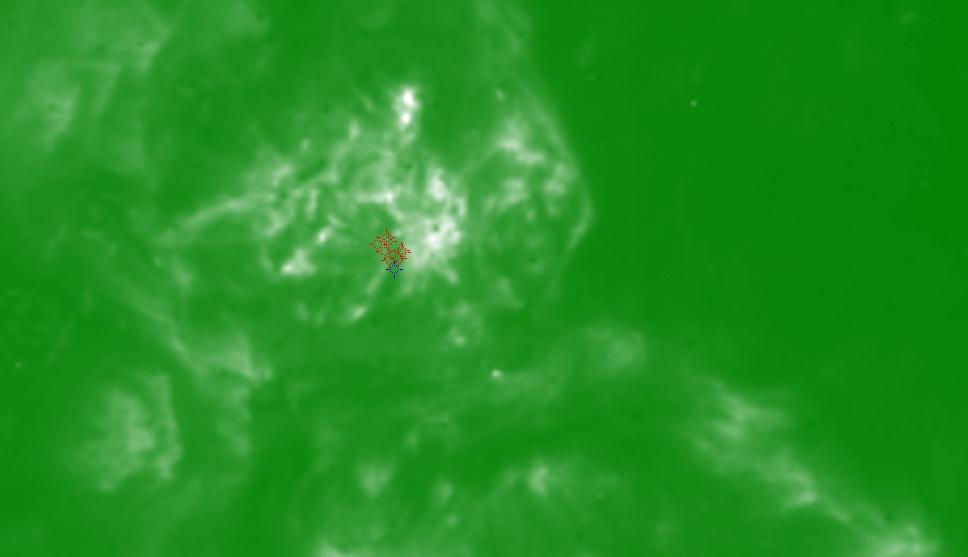
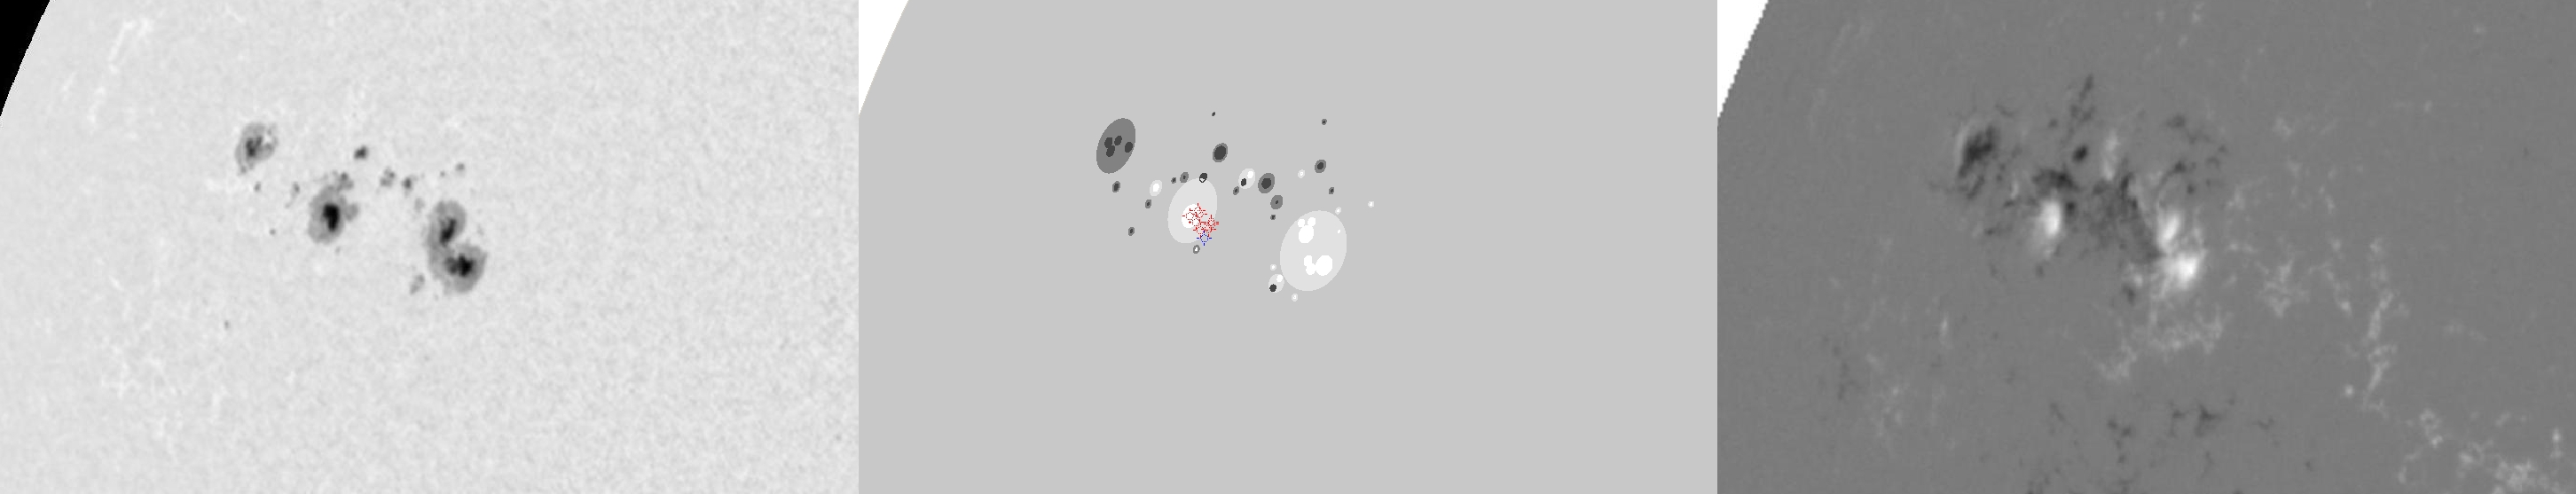
| Evolution of sunspot group NOAA 10030 and positions of flares in it animated by using the data of SOHO/MDI Debrecen Data (SDD) sunspot catalogue (lower panel, middle, ellipses with positions and areas corresponding to the relevant data of spots in SDD and with grey-scale colour coding of the magnetic polarities corresponding to that of the magnetograms), SOHO/MDI continuum images (lower panel, left) and magnetograms (lower panel, right), SOHO/EIT images (upper panel, middle), GOES and RHESSI flare data (red and blue symbols) observed within the interval around the time of SDD data. |
|
When you want to zoom in on one of the images, simply move the mouse pointer over that image. |
 |
| Year | Month | Day | Hour | Min | Sec | NOAA | Proj.U | Proj.WS | Corr.U | Corr.WS | B | L | LCM | Pos.angle | r | MU | MP |
|---|---|---|---|---|---|---|---|---|---|---|---|---|---|---|---|---|---|
| 2002 | 07 | 12 | 12 | 47 | 32 | 10030 | 264 | 1666 | 189 | 1193 | 19.18 | 13.75 | -44.59 | 67.05 | 0.7185 | 476.2 | 89.1 |
| Flare | Date | Start | Peak | End | Dur [s] | Peak [c/s] | Total Counts | Energy [keV] | X pos [asec] | Y pos [asec] | Radial [asec] | B [deg] | L [deg] | Flags |
|---|---|---|---|---|---|---|---|---|---|---|---|---|---|---|
| 2071248 | 12-Jul-2002 | 12:06:04 | 12:06:38 | 12:10:16 | 252 | 56 | 60168 | 6-12 | -650 | 259 | 700 | 18.42 | 12.37 | A0 |
| 20712113 | 12-Jul-2002 | 12:10:16 | 12:11:58 | 12:12:28 | 132 | 88 | 35280 | 6-12 | -647 | 264 | 699 | 18.74 | 12.48 | A0 GE P1 PE |
| 2071249 | 12-Jul-2002 | 12:38:44 | 12:40:02 | 12:41:28 | 164 | 92 | 54192 | 6-12 | -641 | 262 | 692 | 18.65 | 12.79 | A0 |
| 2071279 | 12-Jul-2002 | 12:44:52 | 12:46:26 | 12:48:16 | 204 | 52 | 42480 | 6-12 | -651 | 263 | 702 | 18.67 | 11.83 | A0 |
| 2071250 | 12-Jul-2002 | 12:48:16 | 12:54:06 | 12:57:00 | 524 | 192 | 232944 | 12-25 | -647 | 269 | 701 | 19.05 | 11.99 | A0 |
| 2071209 | 12-Jul-2002 | 12:57:00 | 12:59:26 | 13:02:52 | 352 | 240 | 214992 | 12-25 | -645 | 257 | 694 | 18.33 | 12.36 | A0 |
| 20712114 | 12-Jul-2002 | 13:02:52 | 13:04:02 | 13:07:08 | 256 | 88 | 111168 | 6-12 | -646 | 271 | 701 | 19.18 | 11.94 | A0 |
| 2071280 | 12-Jul-2002 | 13:07:08 | 13:08:54 | 13:10:32 | 204 | 80 | 72168 | 6-12 | -651 | 267 | 704 | 18.91 | 11.54 | A0 |
| Date | Start | Peak | End | Classification | B [deg] | LCM [deg] |
|---|---|---|---|---|---|---|
| 12-Jul-2002 | 12:13 | 12:17 | 12:19 | B7.2 | 18 | -46 |

