move the mouse pointer over that image.
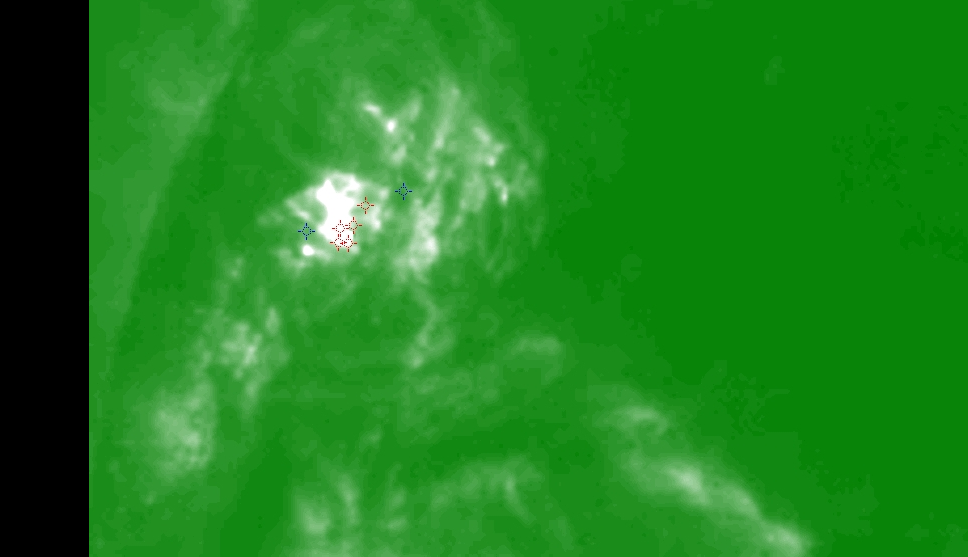
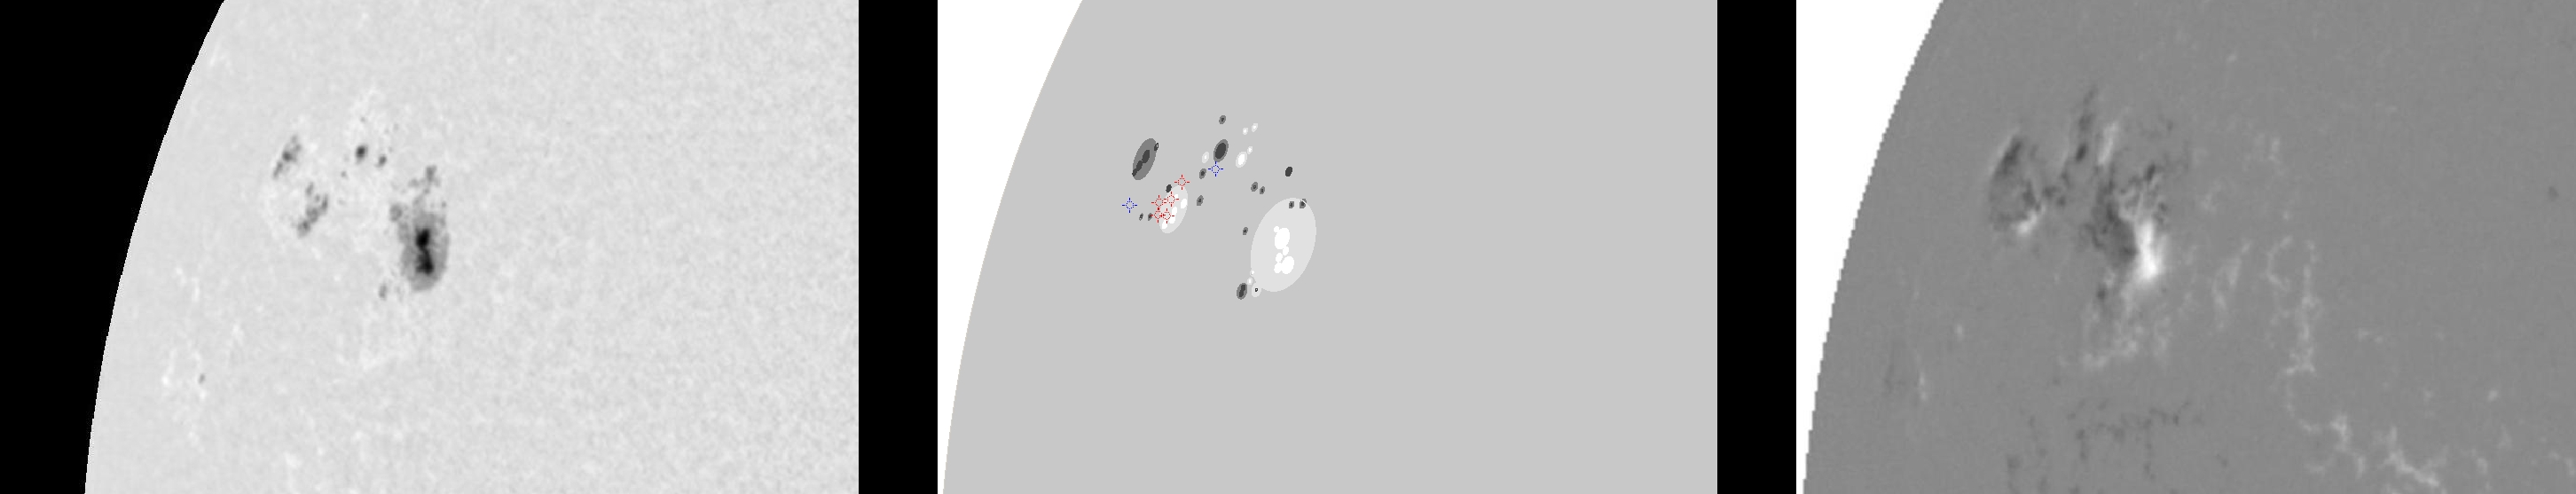
| Evolution of sunspot group NOAA 10030 and positions of flares in it animated by using the data of SOHO/MDI Debrecen Data (SDD) sunspot catalogue (lower panel, middle, ellipses with positions and areas corresponding to the relevant data of spots in SDD and with grey-scale colour coding of the magnetic polarities corresponding to that of the magnetograms), SOHO/MDI continuum images (lower panel, left) and magnetograms (lower panel, right), SOHO/EIT images (upper panel, middle), GOES and RHESSI flare data (red and blue symbols) observed within the interval around the time of SDD data. |
|
When you want to zoom in on one of the images, simply move the mouse pointer over that image. |
 |
| Year | Month | Day | Hour | Min | Sec | NOAA | Proj.U | Proj.WS | Corr.U | Corr.WS | B | L | LCM | Pos.angle | r | MU | MP |
|---|---|---|---|---|---|---|---|---|---|---|---|---|---|---|---|---|---|
| 2002 | 07 | 11 | 14 | 13 | 32 | 10030 | 175 | 1208 | 160 | 1071 | 18.79 | 15.53 | -55.27 | 69.92 | 0.8270 | 386.4 | 46.8 |
| Flare | Date | Start | Peak | End | Dur [s] | Peak [c/s] | Total Counts | Energy [keV] | X pos [asec] | Y pos [asec] | Radial [asec] | B [deg] | L [deg] | Flags |
|---|---|---|---|---|---|---|---|---|---|---|---|---|---|---|
| 2071141 | 11-Jul-2002 | 12:57:44 | 13:02:18 | 13:05:24 | 460 | 18 | 38592 | 6-12 | -790 | 303 | 847 | 20.28 | 9.30 | A1 |
| 2071142 | 11-Jul-2002 | 13:36:12 | 13:36:30 | 13:42:08 | 356 | 16 | 24120 | 6-12 | -801 | 288 | 851 | 19.29 | 8.17 | A1 |
| 2071143 | 11-Jul-2002 | 13:42:08 | 13:42:26 | 13:44:24 | 136 | 12 | 8208 | 6-12 | -801 | 279 | 848 | 18.75 | 8.47 | A1 P1 PE |
| 2071144 | 11-Jul-2002 | 13:44:24 | 13:48:42 | 13:48:48 | 264 | 30 | 21192 | 12-25 | -791 | 290 | 843 | 19.48 | 9.27 | A1 P1 PE |
| 2071106 | 11-Jul-2002 | 14:16:16 | 14:18:22 | 14:26:40 | 624 | 848 | 571752 | 25-50 | -790 | 278 | 837 | 18.77 | 9.57 | A1 |
| Date | Start | Peak | End | Classification | B [deg] | LCM [deg] |
|---|---|---|---|---|---|---|
| 11-Jul-2002 | 14:15 | 14:19 | 14:22 | M1.0 | 19 | -65 |
| 11-Jul-2002 | 14:44 | 14:51 | 14:57 | M5.8 | 21 | -58 |

