move the mouse pointer over that image.
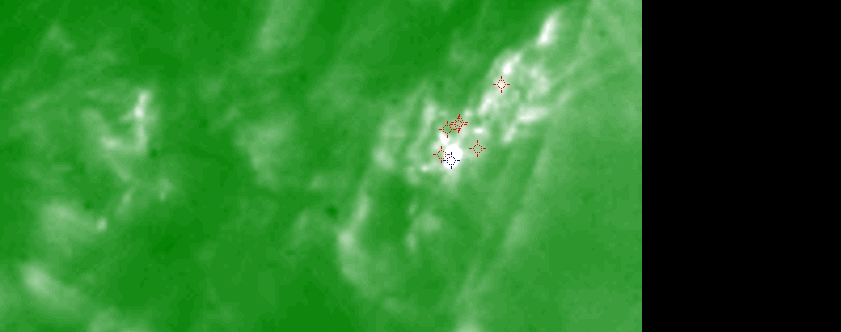
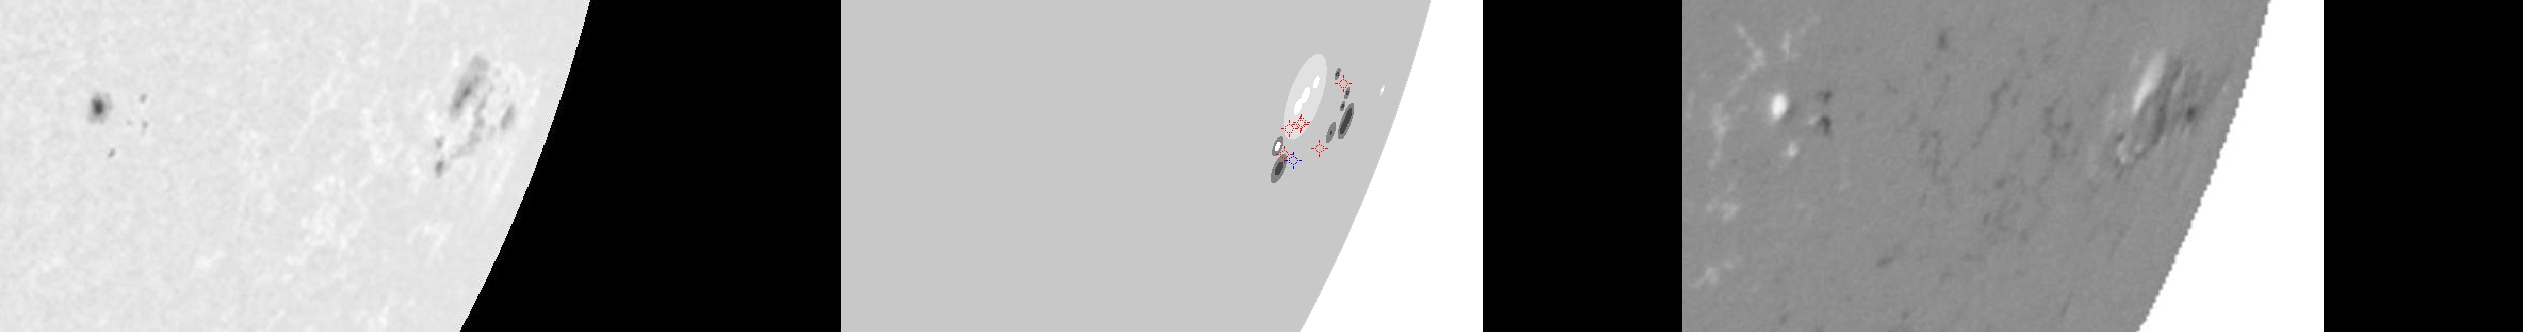
| Evolution of sunspot group NOAA 10017 and positions of flares in it animated by using the data of SOHO/MDI Debrecen Data (SDD) sunspot catalogue (lower panel, middle, ellipses with positions and areas corresponding to the relevant data of spots in SDD and with grey-scale colour coding of the magnetic polarities corresponding to that of the magnetograms), SOHO/MDI continuum images (lower panel, left) and magnetograms (lower panel, right), SOHO/EIT images (upper panel, middle), GOES and RHESSI flare data (red and blue symbols) observed within the interval around the time of SDD data. |
|
When you want to zoom in on one of the images, simply move the mouse pointer over that image. |
 |
| Year | Month | Day | Hour | Min | Sec | NOAA | Proj.U | Proj.WS | Corr.U | Corr.WS | B | L | LCM | Pos.angle | r | MU | MP |
|---|---|---|---|---|---|---|---|---|---|---|---|---|---|---|---|---|---|
| 2002 | 07 | 04 | 13 | 02 | 32 | 10017 | 48 | 405 | 75 | 617 | -17.77 | 233.04 | 68.89 | 249.92 | 0.9463 | 63.4 | -12.7 |
| Flare | Date | Start | Peak | End | Dur [s] | Peak [c/s] | Total Counts | Energy [keV] | X pos [asec] | Y pos [asec] | Radial [asec] | B [deg] | L [deg] | Flags |
|---|---|---|---|---|---|---|---|---|---|---|---|---|---|---|
| 2070452 | 4-Jul-2002 | 11:57:12 | 11:57:22 | 12:03:48 | 396 | 60 | 76224 | 6-12 | 845 | -322 | 905 | -18.44 | 231.78 | A0 DF GS P1 |
| 20704105 | 4-Jul-2002 | 12:03:48 | 12:06:22 | 12:09:52 | 364 | 34 | 49800 | 6-12 | 872 | -298 | 922 | -17.13 | 235.52 | A0 DF P1 |
| 20704106 | 4-Jul-2002 | 12:09:52 | 12:11:50 | 12:13:08 | 196 | 23 | 21755 | 6-12 | 839 | -326 | 900 | -18.65 | 230.82 | A0 DF P1 |
| 20704107 | 4-Jul-2002 | 12:13:08 | 12:15:22 | 12:19:44 | 396 | 76 | 69469 | 6-12 | 836 | -342 | 903 | -19.69 | 231.17 | A0 DF P1 |
| 2070473 | 4-Jul-2002 | 12:19:44 | 12:21:14 | 12:22:28 | 164 | 49 | 26007 | 6-12 | 847 | -323 | 906 | -18.53 | 231.98 | A0 DF P1 |
| 2070411 | 4-Jul-2002 | 13:37:52 | 13:37:58 | 13:59:08 | 1276 | 2032 | 3993264 | 12-25 | 865 | -337 | 929 | -19.67 | 235.91 | A0 DF GS P1 |
| Date | Start | Peak | End | Classification | B [deg] | LCM [deg] |
|---|---|---|---|---|---|---|
| 4-Jul-2002 | 13:26 | 13:34 | 13:50 | C3.0 | -20 | 69 |

