move the mouse pointer over that image.
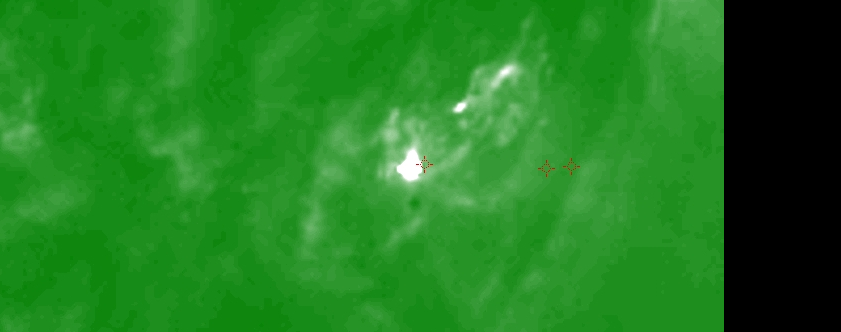
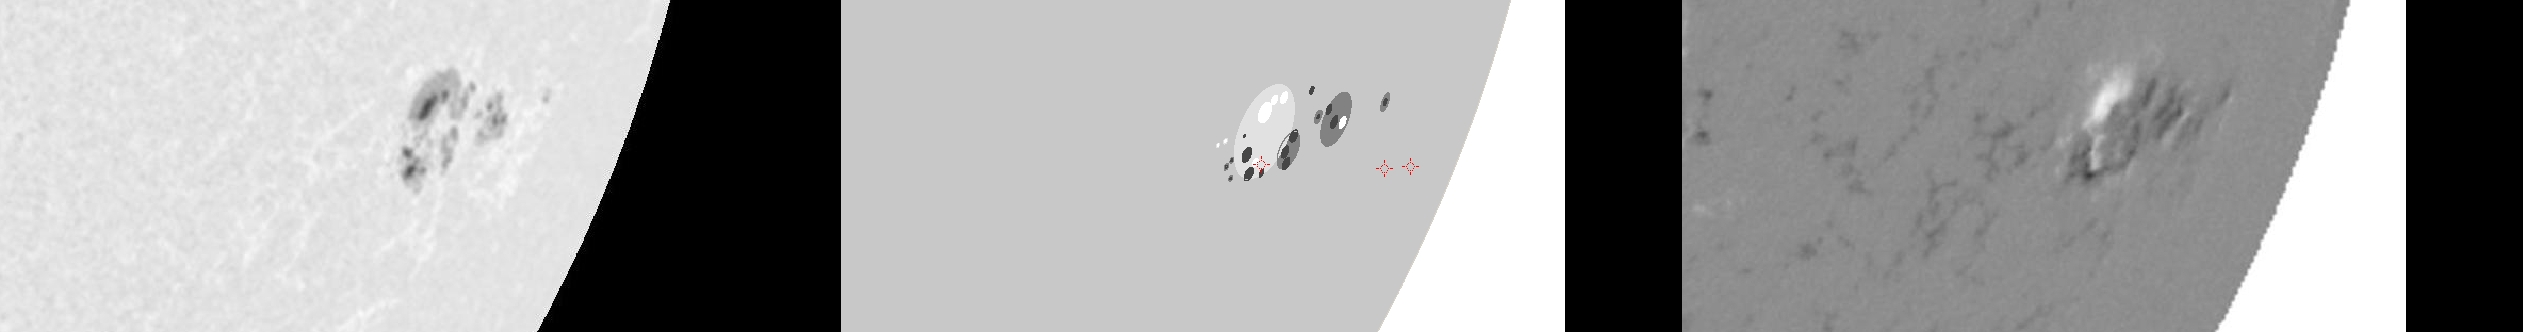
| Evolution of sunspot group NOAA 10017 and positions of flares in it animated by using the data of SOHO/MDI Debrecen Data (SDD) sunspot catalogue (lower panel, middle, ellipses with positions and areas corresponding to the relevant data of spots in SDD and with grey-scale colour coding of the magnetic polarities corresponding to that of the magnetograms), SOHO/MDI continuum images (lower panel, left) and magnetograms (lower panel, right), SOHO/EIT images (upper panel, middle), GOES and RHESSI flare data (red and blue symbols) observed within the interval around the time of SDD data. |
|
When you want to zoom in on one of the images, simply move the mouse pointer over that image. |
 |
| Year | Month | Day | Hour | Min | Sec | NOAA | Proj.U | Proj.WS | Corr.U | Corr.WS | B | L | LCM | Pos.angle | r | MU | MP |
|---|---|---|---|---|---|---|---|---|---|---|---|---|---|---|---|---|---|
| 2002 | 07 | 03 | 19 | 11 | 32 | 10017 | 120 | 784 | 130 | 843 | -18.51 | 233.58 | 59.57 | 247.15 | 0.8882 | 37.1 | -18.5 |
| Flare | Date | Start | Peak | End | Dur [s] | Peak [c/s] | Total Counts | Energy [keV] | X pos [asec] | Y pos [asec] | Radial [asec] | B [deg] | L [deg] | Flags |
|---|---|---|---|---|---|---|---|---|---|---|---|---|---|---|
| 20703110 | 3-Jul-2002 | 18:31:28 | 18:33:58 | 18:41:04 | 576 | 15 | 27304 | 6-12 | 773 | -353 | 850 | -20.00 | 232.20 | a0 A1 DF GS P1 |
| 2070327 | 3-Jul-2002 | 19:02:24 | 19:14:50 | 19:15:28 | 784 | 28 | 85840 | 12-25 | 867 | -354 | 936 | -20.89 | 248.14 | a0 A1 DF P1 |
| 20703138 | 3-Jul-2002 | 19:15:28 | 19:26:18 | 19:38:00 | 1352 | 34 | 206670 | 12-25 | 853 | -355 | 924 | -20.78 | 244.69 | a0 A1 DF P1 |
| Date | Start | Peak | End | Classification | B [deg] | LCM [deg] |
|---|---|---|---|---|---|---|
| No data |

