
move the mouse pointer over that image.
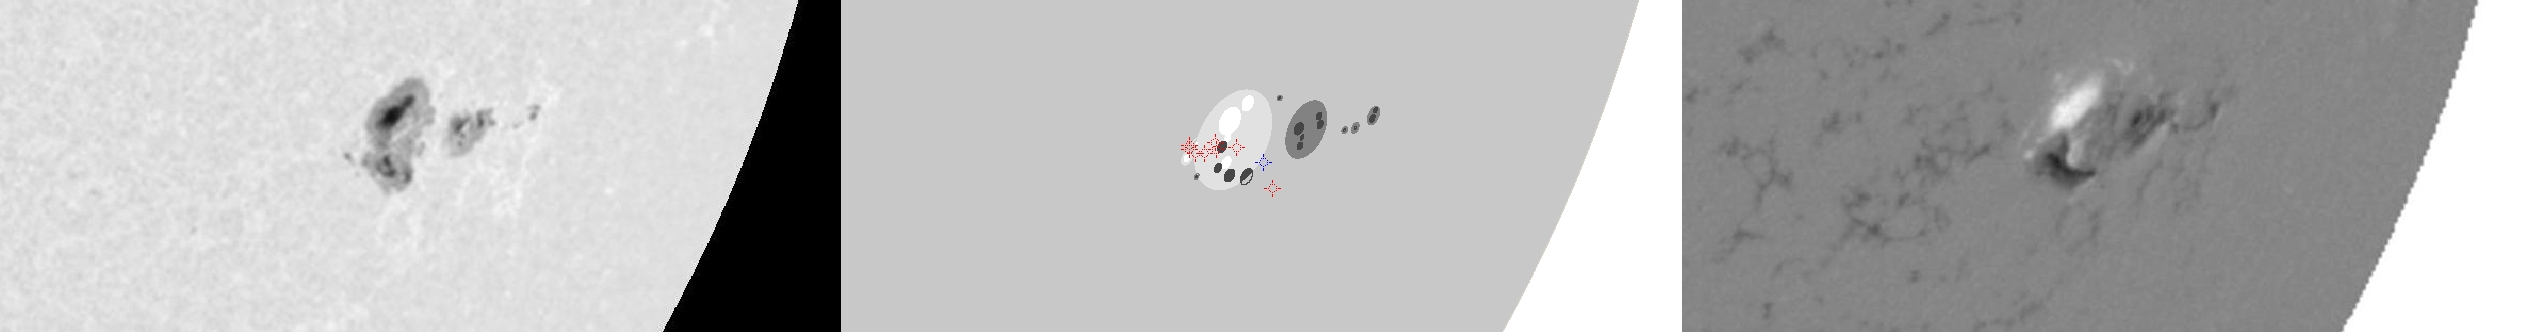
| Evolution of sunspot group NOAA 10017 and positions of flares in it animated by using the data of SOHO/MDI Debrecen Data (SDD) sunspot catalogue (lower panel, middle, ellipses with positions and areas corresponding to the relevant data of spots in SDD and with grey-scale colour coding of the magnetic polarities corresponding to that of the magnetograms), SOHO/MDI continuum images (lower panel, left) and magnetograms (lower panel, right), SOHO/EIT images (upper panel, middle), GOES and RHESSI flare data (red and blue symbols) observed within the interval around the time of SDD data. |
|
When you want to zoom in on one of the images, simply move the mouse pointer over that image. |
 |
| Year | Month | Day | Hour | Min | Sec | NOAA | Proj.U | Proj.WS | Corr.U | Corr.WS | B | L | LCM | Pos.angle | r | MU | MP |
|---|---|---|---|---|---|---|---|---|---|---|---|---|---|---|---|---|---|
| 2002 | 07 | 02 | 23 | 59 | 32 | 10017 | 175 | 1047 | 141 | 857 | -18.78 | 233.35 | 48.75 | 243.42 | 0.7974 | 181.7 | -56.5 |
| Flare | Date | Start | Peak | End | Dur [s] | Peak [c/s] | Total Counts | Energy [keV] | X pos [asec] | Y pos [asec] | Radial [asec] | B [deg] | L [deg] | Flags |
|---|---|---|---|---|---|---|---|---|---|---|---|---|---|---|
| 2070278 | 2-Jul-2002 | 23:15:44 | 23:18:58 | 23:21:36 | 352 | 2 | 2347 | 12-25 | 663 | -346 | 749 | -19.08 | 230.79 | A0 DF P1 |
| 20702124 | 2-Jul-2002 | 23:45:32 | 23:48:02 | 23:49:00 | 208 | 112 | 101016 | 6-12 | 682 | -349 | 767 | -19.34 | 232.41 | A0 DF P1 |
| 2070384 | 3-Jul-2002 | 01:21:32 | 01:26:02 | 01:34:08 | 756 | 12 | 33777 | 6-12 | 688 | -349 | 772 | -19.36 | 232.10 | A0 DF P1 |
| 20703120 | 3-Jul-2002 | 01:50:56 | 01:52:22 | 01:52:44 | 108 | 3 | 1516 | 6-12 | 686 | -351 | 770 | -19.48 | 231.71 | A0 DF P1 |
| 20703121 | 3-Jul-2002 | 01:53:40 | 01:54:02 | 01:54:08 | 28 | 2 | 373 | 6-12 | 681 | -351 | 766 | -19.46 | 231.21 | A0 DF P1 |
| 2070352 | 3-Jul-2002 | 01:54:56 | 01:56:06 | 01:58:56 | 240 | 6 | 5557 | 12-25 | 678 | -346 | 761 | -19.12 | 230.77 | A0 DF P1 |
| 2070385 | 3-Jul-2002 | 02:04:00 | 02:12:58 | 02:36:28 | 1948 | 5307 | 9027739 | 50-100 | 681 | -348 | 765 | -19.27 | 230.95 | a0 a1 A3 DF EE P1 |
| 2070362 | 3-Jul-2002 | 02:57:56 | 02:59:22 | 03:43:00 | 2704 | 1104 | 5656780 | 12-25 | 736 | -372 | 825 | -21.09 | 237.07 | A0 DF P1 PE |
| Date | Start | Peak | End | Classification | B [deg] | LCM [deg] |
|---|---|---|---|---|---|---|
| 3-Jul-2002 | 02:08 | 02:13 | 02:16 | X1.5 | -20 | 51 |

