move the mouse pointer over that image.
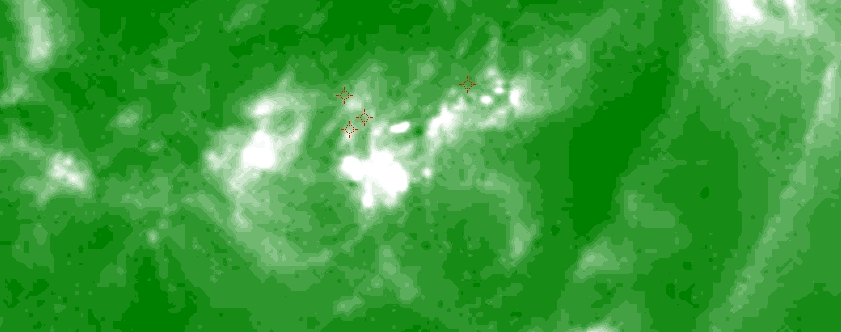
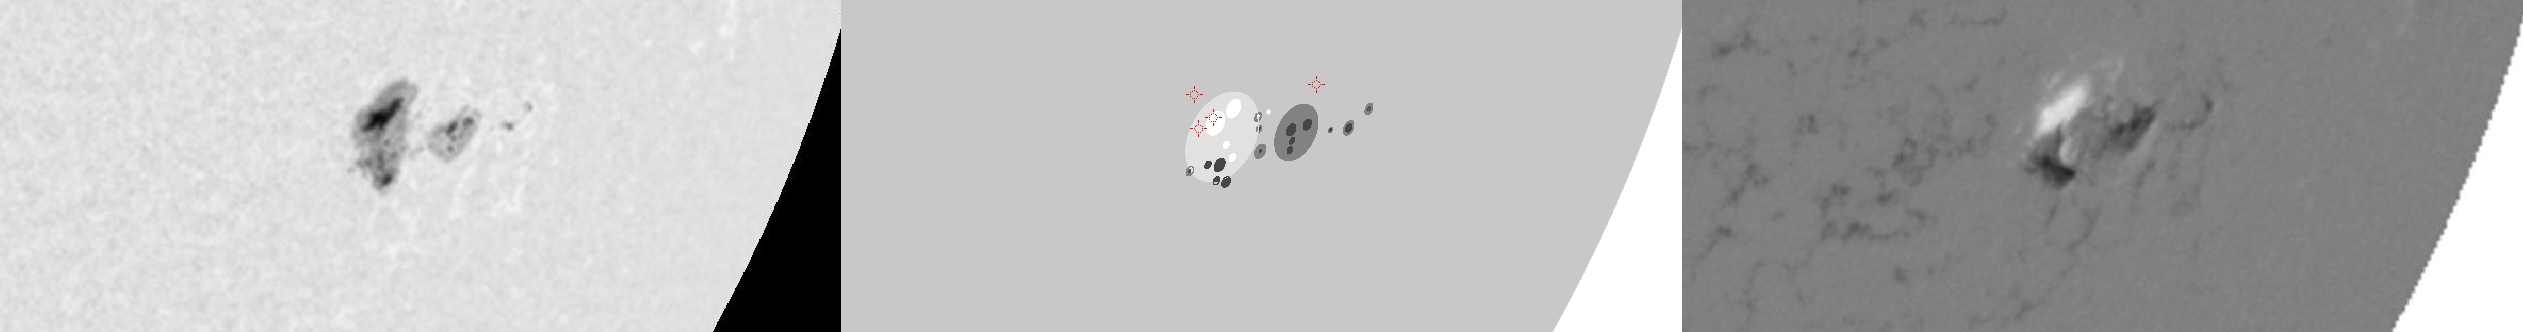
| Evolution of sunspot group NOAA 10017 and positions of flares in it animated by using the data of SOHO/MDI Debrecen Data (SDD) sunspot catalogue (lower panel, middle, ellipses with positions and areas corresponding to the relevant data of spots in SDD and with grey-scale colour coding of the magnetic polarities corresponding to that of the magnetograms), SOHO/MDI continuum images (lower panel, left) and magnetograms (lower panel, right), SOHO/EIT images (upper panel, middle), GOES and RHESSI flare data (red and blue symbols) observed within the interval around the time of SDD data. |
|
When you want to zoom in on one of the images, simply move the mouse pointer over that image. |
 |
| Year | Month | Day | Hour | Min | Sec | NOAA | Proj.U | Proj.WS | Corr.U | Corr.WS | B | L | LCM | Pos.angle | r | MU | MP |
|---|---|---|---|---|---|---|---|---|---|---|---|---|---|---|---|---|---|
| 2002 | 07 | 02 | 17 | 35 | 32 | 10017 | 145 | 957 | 113 | 732 | -18.76 | 233.44 | 45.31 | 242.02 | 0.7640 | 222.7 | -61.9 |
| Flare | Date | Start | Peak | End | Dur [s] | Peak [c/s] | Total Counts | Energy [keV] | X pos [asec] | Y pos [asec] | Radial [asec] | B [deg] | L [deg] | Flags |
|---|---|---|---|---|---|---|---|---|---|---|---|---|---|---|
| 2070267 | 2-Jul-2002 | 16:46:24 | 16:51:46 | 16:56:28 | 604 | 216 | 354960 | 6-12 | 693 | -312 | 760 | -17.02 | 236.41 | A0 DF GS P1 |
| 20702116 | 2-Jul-2002 | 17:41:24 | 17:43:14 | 17:45:40 | 256 | 24 | 19992 | 6-12 | 628 | -318 | 704 | -17.17 | 230.14 | A0 DF P1 |
| 20702152 | 2-Jul-2002 | 17:52:12 | 17:53:58 | 17:55:28 | 196 | 20 | 14136 | 6-12 | 633 | -339 | 718 | -18.54 | 230.89 | A0 DF P1 |
| 20702153 | 2-Jul-2002 | 17:57:36 | 17:58:30 | 18:02:48 | 312 | 16 | 20712 | 6-12 | 643 | -332 | 724 | -18.12 | 231.59 | A0 DF P1 PE |
| Date | Start | Peak | End | Classification | B [deg] | LCM [deg] |
|---|---|---|---|---|---|---|
| No data |

