move the mouse pointer over that image.
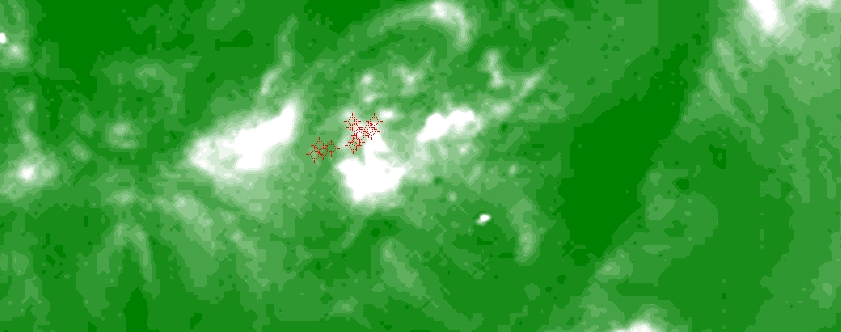
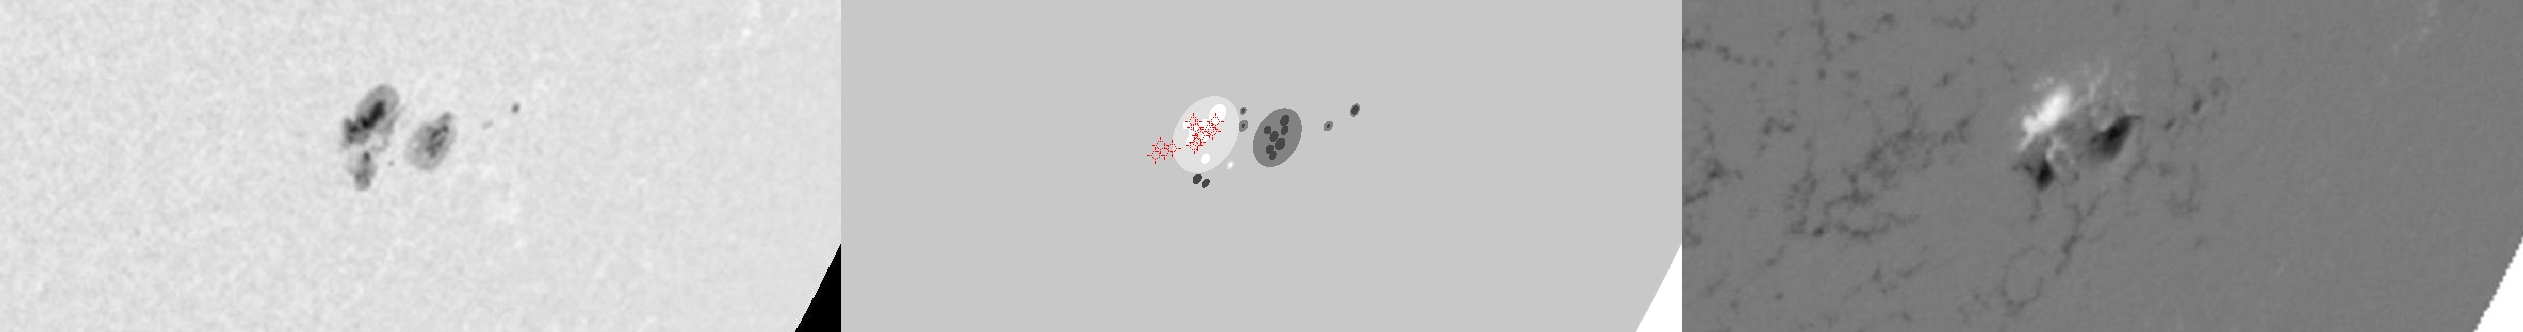
| Evolution of sunspot group NOAA 10017 and positions of flares in it animated by using the data of SOHO/MDI Debrecen Data (SDD) sunspot catalogue (lower panel, middle, ellipses with positions and areas corresponding to the relevant data of spots in SDD and with grey-scale colour coding of the magnetic polarities corresponding to that of the magnetograms), SOHO/MDI continuum images (lower panel, left) and magnetograms (lower panel, right), SOHO/EIT images (upper panel, middle), GOES and RHESSI flare data (red and blue symbols) observed within the interval around the time of SDD data. |
|
When you want to zoom in on one of the images, simply move the mouse pointer over that image. |
 |
| Year | Month | Day | Hour | Min | Sec | NOAA | Proj.U | Proj.WS | Corr.U | Corr.WS | B | L | LCM | Pos.angle | r | MU | MP |
|---|---|---|---|---|---|---|---|---|---|---|---|---|---|---|---|---|---|
| 2002 | 07 | 02 | 07 | 59 | 32 | 10017 | 140 | 820 | 100 | 577 | -18.74 | 233.53 | 40.10 | 239.46 | 0.7101 | 159.9 | -47.5 |
| Flare | Date | Start | Peak | End | Dur [s] | Peak [c/s] | Total Counts | Energy [keV] | X pos [asec] | Y pos [asec] | Radial [asec] | B [deg] | L [deg] | Flags |
|---|---|---|---|---|---|---|---|---|---|---|---|---|---|---|
| 2070247 | 2-Jul-2002 | 07:41:32 | 07:42:30 | 07:44:48 | 196 | 136 | 124176 | 6-12 | 570 | -337 | 662 | -18.26 | 231.15 | A0 P1 PE |
| 20702137 | 2-Jul-2002 | 07:44:48 | 07:46:46 | 07:53:00 | 492 | 168 | 395808 | 6-12 | 572 | -341 | 667 | -18.52 | 231.34 | A0 |
| 20702138 | 2-Jul-2002 | 07:53:00 | 07:56:34 | 08:06:16 | 796 | 184 | 700512 | 6-12 | 583 | -342 | 676 | -18.61 | 232.17 | A0 |
| 20702100 | 2-Jul-2002 | 08:06:16 | 08:12:10 | 08:12:28 | 372 | 272 | 352992 | 6-12 | 590 | -337 | 680 | -18.31 | 232.52 | A0 GE P1 PE |
| 2070259 | 2-Jul-2002 | 08:21:52 | 08:22:02 | 08:23:56 | 124 | 192 | 125952 | 6-12 | 583 | -346 | 678 | -18.87 | 232.01 | A0 GS P1 |
| 20702139 | 2-Jul-2002 | 08:23:56 | 08:25:26 | 08:26:08 | 132 | 192 | 134016 | 6-12 | 580 | -352 | 678 | -19.25 | 231.84 | A0 P1 PE |
| 20702140 | 2-Jul-2002 | 08:26:08 | 08:27:18 | 08:31:52 | 344 | 192 | 291168 | 6-12 | 582 | -350 | 680 | -19.12 | 231.96 | A0 P1 PE |
| 20702141 | 2-Jul-2002 | 08:31:52 | 08:35:10 | 08:53:36 | 1304 | 152 | 669096 | 6-12 | 593 | -343 | 685 | -18.70 | 232.67 | A0 P1 PE |
| 20702104 | 2-Jul-2002 | 10:09:16 | 10:12:42 | 10:15:08 | 352 | 80 | 88128 | 6-12 | 590 | -353 | 688 | -19.33 | 231.71 | A0 |
| 20702142 | 2-Jul-2002 | 10:15:08 | 10:16:42 | 10:18:08 | 180 | 92 | 39600 | 6-12 | 581 | -357 | 682 | -19.57 | 231.00 | A0 |
| 2070261 | 2-Jul-2002 | 10:18:08 | 10:20:14 | 10:26:56 | 528 | 200 | 177120 | 6-12 | 587 | -355 | 687 | -19.45 | 231.43 | A0 |
| 2070262 | 2-Jul-2002 | 10:26:56 | 10:29:30 | 10:30:12 | 196 | 136 | 44232 | 6-12 | 587 | -351 | 684 | -19.19 | 231.27 | A0 |
| Date | Start | Peak | End | Classification | B [deg] | LCM [deg] |
|---|---|---|---|---|---|---|
| No data |

