move the mouse pointer over that image.
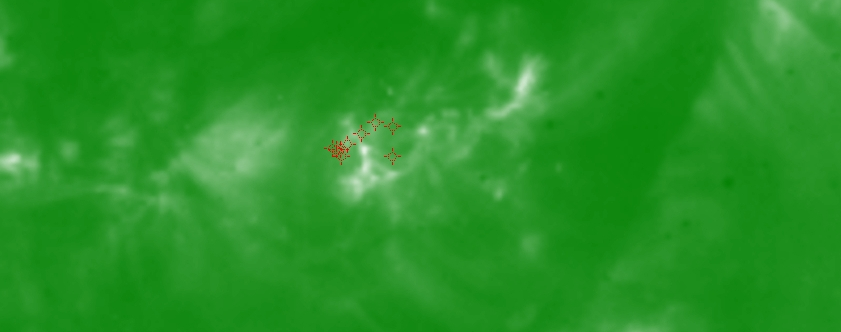
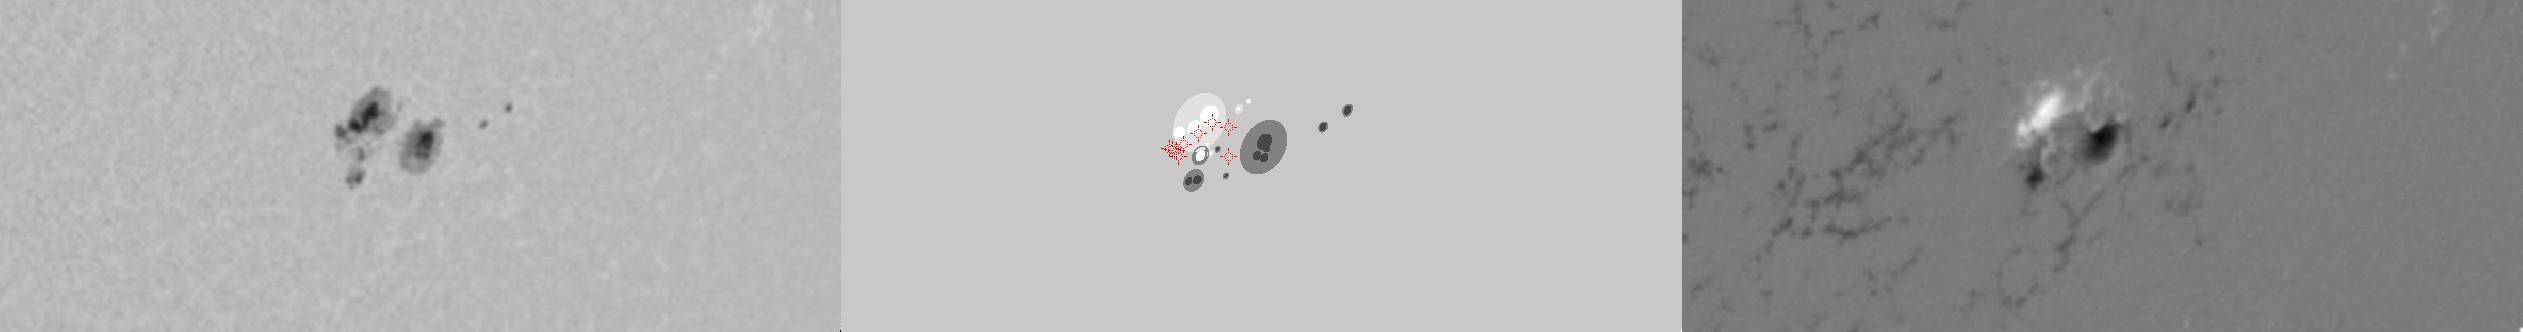
| Evolution of sunspot group NOAA 10017 and positions of flares in it animated by using the data of SOHO/MDI Debrecen Data (SDD) sunspot catalogue (lower panel, middle, ellipses with positions and areas corresponding to the relevant data of spots in SDD and with grey-scale colour coding of the magnetic polarities corresponding to that of the magnetograms), SOHO/MDI continuum images (lower panel, left) and magnetograms (lower panel, right), SOHO/EIT images (upper panel, middle), GOES and RHESSI flare data (red and blue symbols) observed within the interval around the time of SDD data. |
|
When you want to zoom in on one of the images, simply move the mouse pointer over that image. |
 |
| Year | Month | Day | Hour | Min | Sec | NOAA | Proj.U | Proj.WS | Corr.U | Corr.WS | B | L | LCM | Pos.angle | r | MU | MP |
|---|---|---|---|---|---|---|---|---|---|---|---|---|---|---|---|---|---|
| 2002 | 07 | 02 | 03 | 11 | 32 | 10017 | 134 | 681 | 90 | 460 | -18.84 | 233.58 | 37.50 | 237.81 | 0.6826 | 153.4 | -30.0 |
| Flare | Date | Start | Peak | End | Dur [s] | Peak [c/s] | Total Counts | Energy [keV] | X pos [asec] | Y pos [asec] | Radial [asec] | B [deg] | L [deg] | Flags |
|---|---|---|---|---|---|---|---|---|---|---|---|---|---|---|
| 2070254 | 2-Jul-2002 | 02:18:20 | 02:27:06 | 02:27:48 | 568 | 128 | 82824 | 12-25 | 557 | -361 | 663 | -19.79 | 233.42 | A0 DF P1 |
| 2070287 | 2-Jul-2002 | 02:52:24 | 02:53:14 | 02:55:00 | 156 | 46 | 26856 | 6-12 | 535 | -353 | 642 | -19.21 | 231.29 | A0 |
| 20702129 | 2-Jul-2002 | 02:55:00 | 03:01:34 | 03:11:36 | 996 | 64 | 168336 | 6-12 | 565 | -342 | 661 | -18.58 | 233.42 | A0 |
| 2070255 | 2-Jul-2002 | 03:20:24 | 03:23:42 | 03:27:28 | 424 | 108 | 99946 | 6-12 | 535 | -356 | 643 | -19.41 | 231.06 | A0 DF P1 |
| 20702130 | 2-Jul-2002 | 03:27:28 | 03:29:50 | 03:31:40 | 252 | 39 | 43231 | 6-12 | 540 | -360 | 649 | -19.68 | 231.46 | A0 DF P1 |
| 2070246 | 2-Jul-2002 | 03:31:40 | 03:38:06 | 03:46:32 | 892 | 123 | 236551 | 6-12 | 563 | -339 | 657 | -18.38 | 232.87 | A0 DF P1 PE |
| 2070290 | 2-Jul-2002 | 03:46:32 | 03:49:30 | 03:52:56 | 384 | 41 | 52457 | 6-12 | 557 | -346 | 656 | -18.81 | 232.40 | A0 DF P1 |
| 2070291 | 2-Jul-2002 | 03:52:56 | 03:55:30 | 04:01:48 | 532 | 41 | 57147 | 6-12 | 545 | -356 | 651 | -19.43 | 231.56 | A0 DF P1 |
| 20702131 | 2-Jul-2002 | 04:01:48 | 04:02:06 | 04:04:08 | 140 | 14 | 9504 | 6-12 | 542 | -355 | 648 | -19.36 | 231.24 | A0 DF P1 |
| Date | Start | Peak | End | Classification | B [deg] | LCM [deg] |
|---|---|---|---|---|---|---|
| No data |

