
move the mouse pointer over that image.
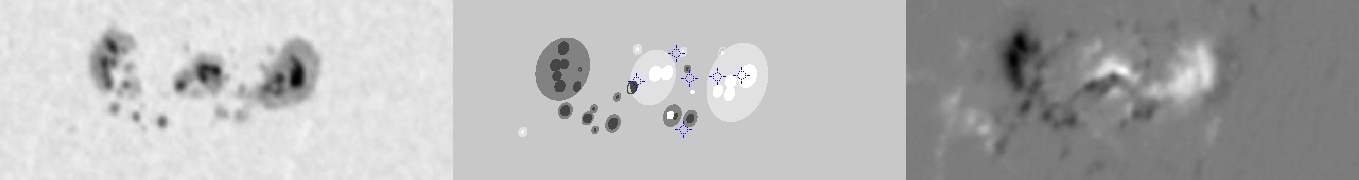
| Evolution of sunspot group NOAA 7978 and positions of flares in it animated by using the data of SOHO/MDI Debrecen Data (SDD) sunspot catalogue (lower panel, middle, ellipses with positions and areas corresponding to the relevant data of spots in SDD and with grey-scale colour coding of the magnetic polarities corresponding to that of the magnetograms), SOHO/MDI continuum images (lower panel, left) and magnetograms (lower panel, right), SOHO/EIT images (upper panel, middle), GOES and RHESSI flare data (red and blue symbols) observed within the interval around the time of SDD data. |
|
When you want to zoom in on one of the images, simply move the mouse pointer over that image. |
 |
| Year | Month | Day | Hour | Min | Sec | NOAA | Proj.U | Proj.WS | Corr.U | Corr.WS | B | L | LCM | Pos.angle | r | MU | MP |
|---|---|---|---|---|---|---|---|---|---|---|---|---|---|---|---|---|---|
| 1996 | 07 | 10 | 01 | 05 | 35 | 7978 | 231 | 1278 | 151 | 848 | -10.94 | 248.96 | 38.98 | 248.59 | 0.6642 | 167.6 | 108.2 |
| Flare | Date | Start | Peak | End | Dur [s] | Peak [c/s] | Total Counts | Energy [keV] | X pos [asec] | Y pos [asec] | Radial [asec] | B [deg] | L [deg] | Flags |
|---|---|---|---|---|---|---|---|---|---|---|---|---|---|---|
| No data |
| Date | Start | Peak | End | Classification | B [deg] | LCM [deg] |
|---|---|---|---|---|---|---|
| 9-Jul-1996 | 18:49 | 19:01 | 19:35 | C1.7 | -11 | 37 |
| 10-Jul-1996 | 00:10 | 00:27 | 00:32 | B9.4 | -13 | 40 |
| 10-Jul-1996 | 03:30 | 03:31 | 03:34 | M1.0 | -11 | 39 |
| 10-Jul-1996 | 05:44 | 05:47 | 06:04 | C2.7 | -10 | 42 |
| 10-Jul-1996 | 10:29 | 10:30 | 10:42 | B9.8 | -11 | 48 |
| 10-Jul-1996 | 10:57 | 10:58 | 11:14 | C1.2 | -11 | 47 |

