SOHO/MDI 2007-12-09 16:14:31 UT
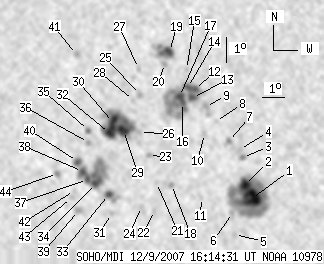
| group | Proj. U | Proj. WS | Corr. U | Corr. WS | B | L | LCM | Pos. angle | r |
| 112 | 707 | 64 | 414 | -8.77 | 224.63 | -30.45 | 106.87 | 0.5256 | |
|
previous
or next day for the same group /
back to the solar disc SOHO/MDI 2007-12-09 16:14:31 UT |
| spot | Proj. U | Proj. WS | Corr. U | Corr. WS | B | L | LCM | Pos. angle | r |
| 29 | 190 | 16 | 108 | -10.74 | 228.20 | -26.88 | 112.56 | 0.4830 | |
| 11 | -1 | 6 | -1 | -10.20 | 227.95 | -27.14 | 111.32 | 0.4839 | |
| 0 | 4 | 0 | 2 | -9.14 | 227.95 | -27.13 | 109.23 | 0.4789 | |
| 0 | 5 | 0 | 3 | -8.83 | 227.84 | -27.24 | 108.55 | 0.4790 | |
| 0 | 4 | 0 | 2 | -12.15 | 227.30 | -27.78 | 114.61 | 0.5032 | |
| 0 | 6 | 0 | 3 | -11.29 | 227.31 | -27.77 | 113.00 | 0.4985 | |
| 0 | 7 | 0 | 4 | -8.52 | 227.39 | -27.69 | 107.66 | 0.4844 | |
| 0 | 3 | 0 | 2 | -7.74 | 226.87 | -28.21 | 105.85 | 0.4889 | |
| 0 | 11 | 0 | 6 | -7.16 | 226.48 | -28.61 | 104.50 | 0.4927 | |
| 0 | 5 | 0 | 3 | -8.21 | 226.35 | -28.73 | 106.51 | 0.4982 | |
| 0 | 4 | 0 | 2 | -10.70 | 225.99 | -29.09 | 111.05 | 0.5140 | |
| 3 | 130 | 2 | 74 | -6.51 | 226.03 | -29.05 | 103.01 | 0.4972 | |
| 4 | -12 | 2 | -12 | -6.81 | 225.92 | -29.16 | 103.58 | 0.4998 | |
| 3 | -12 | 2 | -12 | -6.43 | 225.73 | -29.35 | 102.74 | 0.5015 | |
| 0 | 3 | 0 | 2 | -5.73 | 225.72 | -29.36 | 101.37 | 0.4996 | |
| 2 | -12 | 1 | -12 | -7.01 | 225.47 | -29.62 | 103.77 | 0.5071 | |
| 6 | -12 | 3 | -12 | -6.78 | 225.35 | -29.73 | 103.28 | 0.5081 | |
| 0 | 4 | 0 | 3 | -10.19 | 224.69 | -30.39 | 109.39 | 0.5300 | |
| 7 | 31 | 4 | 18 | -5.04 | 225.01 | -30.08 | 99.78 | 0.5087 | |
| 0 | 4 | 0 | 3 | -5.50 | 224.76 | -30.32 | 100.60 | 0.5134 | |
| 0 | 3 | 0 | 2 | -10.11 | 224.02 | -31.06 | 108.90 | 0.5391 | |
| 0 | 4 | 0 | 2 | -11.21 | 223.80 | -31.28 | 110.72 | 0.5467 | |
| 0 | 3 | 0 | 2 | -9.06 | 223.76 | -31.32 | 106.88 | 0.5386 | |
| 0 | 7 | 0 | 4 | -11.05 | 223.22 | -31.86 | 110.14 | 0.5540 | |
| 0 | 3 | 0 | 2 | -6.70 | 223.60 | -31.48 | 102.49 | 0.5334 | |
| 0 | 4 | 0 | 3 | -8.17 | 223.43 | -31.65 | 105.12 | 0.5402 | |
| 0 | 4 | 0 | 3 | -5.69 | 223.57 | -31.51 | 100.61 | 0.5312 | |
| 0 | 3 | 0 | 2 | -6.93 | 223.26 | -31.82 | 102.80 | 0.5389 | |
| 8 | 115 | 4 | 68 | -8.09 | 222.71 | -32.37 | 104.69 | 0.5502 | |
| 12 | -29 | 7 | -29 | -7.78 | 222.27 | -32.81 | 103.98 | 0.5554 | |
| 0 | 3 | 0 | 2 | -11.33 | 221.79 | -33.29 | 109.89 | 0.5746 | |
| 9 | -29 | 5 | -29 | -8.21 | 222.05 | -33.03 | 104.65 | 0.5599 | |
| 3 | 18 | 2 | 11 | -10.58 | 221.74 | -33.34 | 108.61 | 0.5723 | |
| 3 | 93 | 2 | 56 | -10.15 | 221.19 | -33.90 | 107.64 | 0.5783 | |
| 0 | 6 | 0 | 3 | -8.09 | 221.08 | -34.00 | 104.10 | 0.5731 | |
| 0 | 5 | 0 | 3 | -8.56 | 221.04 | -34.05 | 104.88 | 0.5751 | |
| 3 | -34 | 2 | -34 | -10.00 | 220.83 | -34.25 | 107.23 | 0.5826 | |
| 4 | -34 | 3 | -34 | -9.68 | 220.63 | -34.45 | 106.63 | 0.5843 | |
| 0 | 8 | 0 | 5 | -11.21 | 220.24 | -34.84 | 108.98 | 0.5949 | |
| 5 | -34 | 3 | -34 | -9.29 | 220.44 | -34.65 | 105.90 | 0.5856 | |
| 0 | 5 | 0 | 3 | -5.15 | 220.75 | -34.33 | 98.91 | 0.5708 | |
| 0 | 3 | 0 | 2 | -10.42 | 220.16 | -34.93 | 107.66 | 0.5932 | |
| 0 | 3 | 0 | 2 | -10.70 | 219.98 | -35.10 | 108.03 | 0.5966 | |
| 0 | 6 | 0 | 4 | -9.76 | 219.43 | -35.66 | 106.29 | 0.6008 | |
| Proj. U | - Projected umbra area in millionths of solar disc, negative values indicate | |
|
that the umbra consists of fragmented regions which cannot be separated without losing umbral area. In this way several spots (intensity minima in the umbra) have a common umbra, e.g. -2 means that the given spot shares an umbra with spot No.2, and the common U value is indicated at spot No.2. |
||
| Proj. WS | - Projected whole spot area in millionths of solar disc, negative values indicate | |
|
that several umbras have a common penumbra, e.g. -7 means that the given umbra shares a penumbra with umbra No.7, and the WS value is indicated at No.7. |
||
| Corr. U | - Corrected umbra area in millionths of solar hemisphere, for negative values see above | |
| Corr. WS | - Corrected whole spot area in millionths of solar hemisphere, for negative values see above | |
| B | - Heliographic latitude B; positive: North, negative: South | |
| L | - Heliographic longitude L | |
| LCM | - Longitudinal distance from the Sun's central meridian | |
| Pos. angle | - Position angle | |
| r | - Distance from the centre of Sun's disc in terms of Sun's radius | |