SOHO/MDI 2006-01-22 12:47:32 UT
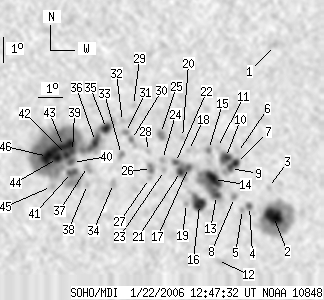
| group | Proj. U | Proj. WS | Corr. U | Corr. WS | B | L | LCM | Pos. angle | r |
| 152 | 924 | 79 | 476 | -19.09 | 320.85 | 8.38 | 208.61 | 0.2813 | |
|
previous
or next day for the same group /
back to the solar disc SOHO/MDI 2006-01-22 12:47:32 UT |
| spot | Proj. U | Proj. WS | Corr. U | Corr. WS | B | L | LCM | Pos. angle | r |
| 0 | 7 | 0 | 4 | -14.23 | 325.65 | 13.18 | 234.33 | 0.2732 | |
| 22 | 137 | 11 | 72 | -20.94 | 326.11 | 13.64 | 218.90 | 0.3524 | |
| 0 | 5 | 0 | 2 | -19.80 | 325.80 | 13.33 | 220.54 | 0.3353 | |
| 2 | 8 | 1 | 4 | -20.56 | 325.07 | 12.60 | 217.48 | 0.3372 | |
| 0 | 4 | 0 | 2 | -20.69 | 324.79 | 12.32 | 216.64 | 0.3359 | |
| 0 | 1 | 0 | 0 | -18.44 | 324.41 | 11.94 | 220.44 | 0.3039 | |
| 4 | 49 | 2 | 26 | -18.83 | 324.39 | 11.92 | 219.54 | 0.3086 | |
| 0 | 4 | 0 | 2 | -20.22 | 324.41 | 11.94 | 216.72 | 0.3263 | |
| 3 | -7 | 1 | -7 | -19.07 | 324.16 | 11.69 | 218.48 | 0.3092 | |
| 9 | -7 | 5 | -7 | -18.64 | 323.92 | 11.46 | 218.86 | 0.3013 | |
| 0 | 4 | 0 | 2 | -18.26 | 323.57 | 11.10 | 218.86 | 0.2927 | |
| 0 | 9 | 0 | 5 | -22.75 | 323.90 | 11.44 | 211.15 | 0.3551 | |
| 5 | 87 | 3 | 45 | -20.15 | 323.66 | 11.19 | 215.12 | 0.3181 | |
| 17 | -13 | 9 | -13 | -19.52 | 323.49 | 11.02 | 215.96 | 0.3082 | |
| 0 | 6 | 0 | 3 | -18.34 | 323.20 | 10.73 | 217.77 | 0.2900 | |
| 14 | 36 | 7 | 19 | -20.52 | 322.98 | 10.51 | 212.80 | 0.3167 | |
| 3 | 41 | 2 | 21 | -19.06 | 322.43 | 9.96 | 214.22 | 0.2919 | |
| 0 | 3 | 0 | 2 | -18.39 | 322.39 | 9.92 | 215.53 | 0.2825 | |
| 0 | 3 | 0 | 2 | -20.49 | 322.43 | 9.96 | 211.52 | 0.3115 | |
| 0 | 4 | 0 | 2 | -17.89 | 322.11 | 9.64 | 215.90 | 0.2731 | |
| 6 | -17 | 3 | -17 | -19.23 | 322.11 | 9.64 | 213.05 | 0.2912 | |
| 2 | -17 | 1 | -17 | -18.87 | 321.88 | 9.41 | 213.15 | 0.2842 | |
| 0 | 5 | 0 | 2 | -19.20 | 321.45 | 8.98 | 211.31 | 0.2849 | |
| 0 | 4 | 0 | 2 | -18.76 | 321.34 | 8.87 | 211.87 | 0.2779 | |
| 0 | 12 | 0 | 6 | -17.74 | 321.21 | 8.74 | 213.63 | 0.2624 | |
| 0 | 10 | 0 | 5 | -19.16 | 320.91 | 8.44 | 209.85 | 0.2798 | |
| 0 | 3 | 0 | 1 | -19.52 | 320.85 | 8.38 | 209.01 | 0.2844 | |
| 0 | 4 | 0 | 2 | -18.46 | 320.75 | 8.28 | 210.77 | 0.2684 | |
| 0 | 3 | 0 | 2 | -16.66 | 320.06 | 7.59 | 212.50 | 0.2367 | |
| 0 | 10 | 0 | 5 | -17.99 | 320.04 | 7.57 | 209.49 | 0.2557 | |
| 0 | 7 | 0 | 4 | -17.72 | 319.78 | 7.31 | 209.22 | 0.2496 | |
| 0 | 12 | 0 | 6 | -17.29 | 319.64 | 7.17 | 209.66 | 0.2421 | |
| 0 | 7 | 0 | 4 | -18.59 | 319.66 | 7.19 | 207.12 | 0.2613 | |
| 0 | 7 | 0 | 4 | -19.74 | 319.38 | 6.91 | 204.29 | 0.2766 | |
| 7 | 415 | 4 | 212 | -17.57 | 319.01 | 6.54 | 206.88 | 0.2412 | |
| 7 | -35 | 4 | -35 | -18.09 | 318.58 | 6.11 | 204.42 | 0.2459 | |
| 0 | 9 | 0 | 4 | -19.07 | 318.29 | 5.82 | 201.80 | 0.2592 | |
| 0 | 4 | 0 | 2 | -19.79 | 318.32 | 5.85 | 200.85 | 0.2705 | |
| 3 | -35 | 2 | -35 | -18.49 | 317.66 | 5.19 | 200.50 | 0.2462 | |
| 1 | -35 | 0 | -35 | -18.92 | 317.67 | 5.20 | 199.91 | 0.2531 | |
| 3 | -35 | 1 | -35 | -19.32 | 317.64 | 5.18 | 199.26 | 0.2592 | |
| 4 | -35 | 2 | -35 | -18.61 | 317.42 | 4.95 | 199.45 | 0.2467 | |
| 21 | -35 | 11 | -35 | -18.29 | 317.29 | 4.82 | 199.43 | 0.2410 | |
| 4 | -35 | 2 | -35 | -18.77 | 317.06 | 4.59 | 197.93 | 0.2473 | |
| 0 | 4 | 0 | 2 | -19.88 | 316.84 | 4.38 | 195.84 | 0.2641 | |
| 15 | -35 | 8 | -35 | -18.69 | 316.65 | 4.18 | 196.52 | 0.2440 | |
| Proj. U | - Projected umbra area in millionths of solar disc, negative values indicate | |
|
that the umbra consists of fragmented regions which cannot be separated without losing umbral area. In this way several spots (intensity minima in the umbra) have a common umbra, e.g. -2 means that the given spot shares an umbra with spot No.2, and the common U value is indicated at spot No.2. |
||
| Proj. WS | - Projected whole spot area in millionths of solar disc, negative values indicate | |
|
that several umbras have a common penumbra, e.g. -7 means that the given umbra shares a penumbra with umbra No.7, and the WS value is indicated at No.7. |
||
| Corr. U | - Corrected umbra area in millionths of solar hemisphere, for negative values see above | |
| Corr. WS | - Corrected whole spot area in millionths of solar hemisphere, for negative values see above | |
| B | - Heliographic latitude B; positive: North, negative: South | |
| L | - Heliographic longitude L | |
| LCM | - Longitudinal distance from the Sun's central meridian | |
| Pos. angle | - Position angle | |
| r | - Distance from the centre of Sun's disc in terms of Sun's radius | |